Crop Analysis Detailed Bar Graph – Insights into Market and Competition
RJ0400031_8
- Last Update 05/26/2025
- File Size 8MB
- # of Slides 2
- File Format PPTX
- Slide Ratio 16:9
- Color
Keywords
- #Content-Based Slides
- #Design-Based Slides
- #Market and Competitor Analysis
- #Diagram
- #Graph
- #Market Analysis
- #Cluster
- #Horizontal Bar
- #Closed Cluster Diagram
- #Segmented Horizontal Bar
- #16:9
- #segmented bar chart PowerPoint
- #3-series bar graph template
- #market comparison slide
- #crop analysis chart
- #competitive analysis PPT
- #horizontal bar chart download
About the Product
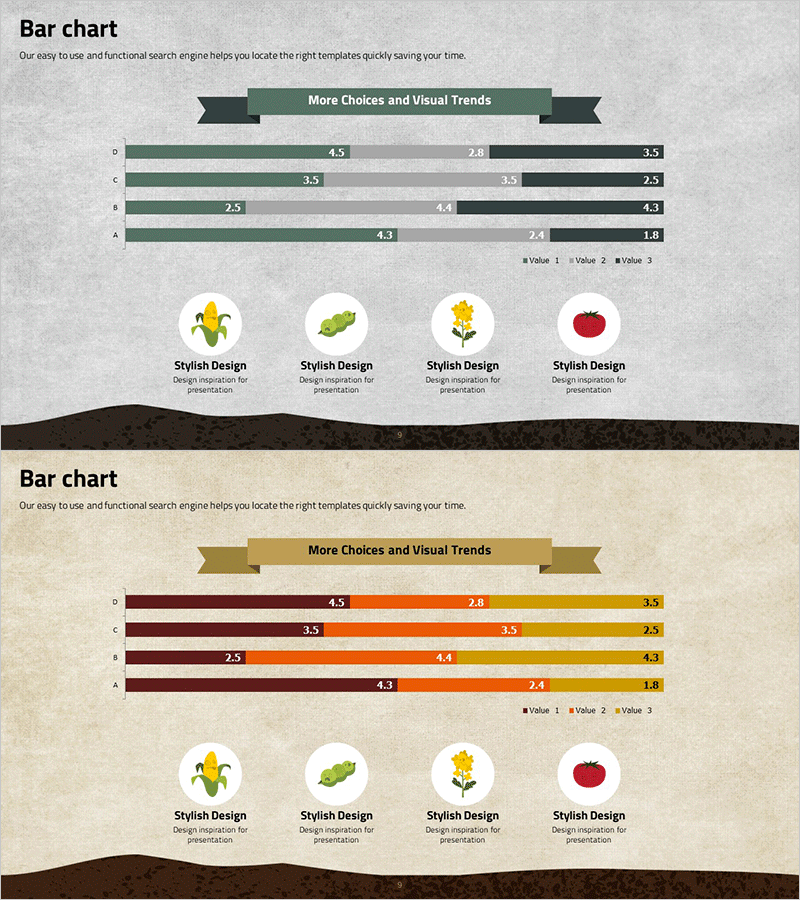
A segmented bar chart PowerPoint slide optimized for crop market analysis and competitive benchmarking. The horizontal bar chart features three data series in dark green, orange, and yellow, enabling simultaneous comparison of four items with multiple values. Each item displays three bars side-by-side, making it ideal for presenting market size, competitor share, and growth rates in a single visualization. Delivered as 2 slides in 16:9 widescreen format with fully editable numbers and legends. Perfect for business plans, market analysis reports, and investor pitch decks where competitive landscape insights are critical.
Usage Points
-
Main Usage
Simultaneously compare three or more numerical metrics such as market size, competitor market share, and growth rates across multiple items. The segmented structure clearly distinguishes each data series, providing instant visibility into competitive market dynamics.
-
How to Use
Deploy in the market analysis section of business plans, competitive landscape slides in investor presentations, or market overview segments in marketing strategy documents. Simply replace the legend labels and numerical values with your own data for immediate presentation use.
-
Recommended For
Agricultural startup founders, agribusiness executives, agricultural policy analysts, market research professionals, and investment managers presenting competitive positioning and market dynamics to stakeholders.
-
Slide Structure
2-slide deck with horizontal segmented bar charts. Each slide displays 4 items (A, B, C, D) with 3 data series per item. Color-coded in dark green, orange, and yellow for easy differentiation. Numerical values appear above each bar segment for precise comparison. Title and legend areas are fully customizable.
Related Products
-

Business Solutions Analysis Graph – The Optimal Tool for Market Analysis
#Business Introduction #Market and Competitor Analysis #Diagram
-

Market Analysis Graph Ahead of the Future – Innovative Business Insights
#Market and Competitor Analysis #Diagram #Graph
-

Space Industry Segmentation Bar Graph – Essential for Market Analysis
#Market and Competitor Analysis #Diagram #Graph
-

Performance Analysis Breakdown Bar Graph – Market and Competitor Analysis
#Company Introduction #Market and Competitor Analysis #Diagram
