Market Analysis Graph Ahead of the Future – Innovative Business Insights
RJ0700025_22
- Last Update 07/29/2025
- File Size 1.3MB
- # of Slides 3
- File Format PPTX
- Slide Ratio 16:9
- Color
Keywords
- #Content-Based Slides
- #Design-Based Slides
- #Market and Competitor Analysis
- #Diagram
- #Graph
- #Competitor Analysis
- #Market Analysis
- #Cluster
- #Horizontal Bar
- #Closed Cluster Diagram
- #Segmented Horizontal Bar
- #16:9
- #radial diagram PowerPoint
- #market analysis chart slide
- #4-node diagram template
- #competitive comparison PPT
- #business insight presentation slide
About the Product
A 4-node radial diagram PowerPoint slide set with 3 slides designed for market analysis and competitive comparison. The structure radiates from a central concept to four directional nodes, each featuring a hexagonal icon and text area. Applied with a black background and purple-to-pink gradient accent lines, this design optimizes data comparison and business insight delivery. Available in 16:9 widescreen PPTX format, fully editable and ready for strategic presentations and business reports.
Usage Points
-
Main Usage
This radial diagram is designed for market analysis, competitive comparison, and business insight communication. The structure radiates from a central core concept to four directional elements, clearly expressing relationships between key factors and supporting details. Highly effective for data-driven decision-making and strategic planning phases.
-
How to Use
Input market segments, competitor characteristics, strengths and weaknesses into each node's text area. Place your analysis topic or key message in the central area. Use color gradient lines to differentiate priorities or categories, and customize icons to match industry-specific needs.
-
Recommended For
Marketing professionals, strategic planning teams, and executives preparing market analysis reports and competitive strategy presentations. Ideal for investor pitch decks, business plan presentations, and quarterly performance analysis materials.
-
Slide Structure
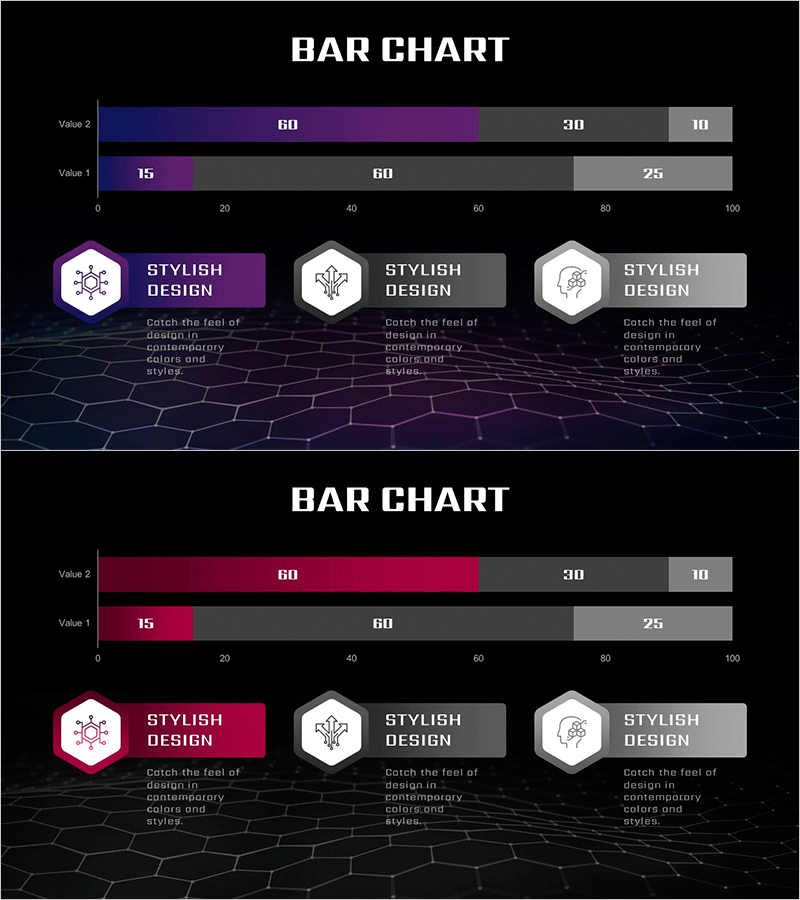
3-slide set: Slides 1-2 feature 4-node radial diagrams with purple-to-pink gradient accent lines; Slide 3 offers a grayscale alternative version. Each slide contains one central hexagonal icon and four surrounding nodes (hexagonal text boxes) arranged radially, with a black background network pattern providing visual depth.
Related Products
-

Space Industry Segmentation Bar Graph – Essential for Market Analysis
#Market and Competitor Analysis #Diagram #Graph
-

Chemical Experiment Analysis Horizontal Bar Graph
#Market and Competitor Analysis #Graph #Competitor Analysis
-

Spaceship Launch Analysis Graph – Ideal for Competitor Analysis
#Market and Competitor Analysis #Diagram #Graph
-

Segmented Bar Graph for Market and Competitor Analysis
#Market and Competitor Analysis #Graph #Competitor Analysis
