Visualizing Future Service Development Procedures – Strategies for Innovation
RM0200010_24
- Last Update 02/04/2025
- File Size 0.3MB
- # of Slides 2
- File Format PPTX
- Slide Ratio 16:9
- Color
Keywords
- #Content-Based Slides
- #Design-Based Slides
- #Product/Service Introduction
- #Business Strategy
- #Diagram
- #Graph
- #Differentiation Strategy for Products/Services
- #Step-by-Step Schedule Plan
- #Flow
- #Column
- #Linear Flow
- #Grouped Column
- #16:9
- #service development process diagram
- #5-step flowchart PowerPoint
- #clustered bar chart slide
- #business strategy visualization
- #process flow diagram template
About the Product
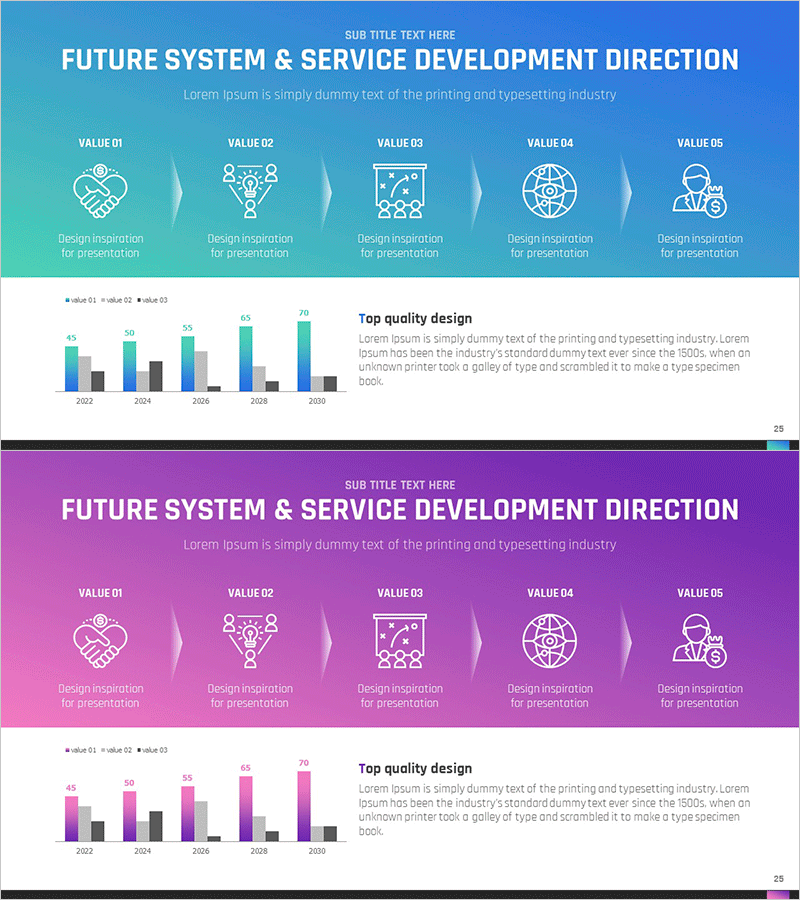
A comprehensive PowerPoint slide visualizing future service development direction through five core values (design inspiration, collaborative design, data analysis, global network, expert management) combined with year-over-year performance trends. The slide features an icon-based flow diagram on a blue and pink dual-tone background paired with a clustered bar chart comparing four data series from 2022 to 2030. This design effectively communicates both strategic direction and quantitative results, making it ideal for strategy presentations, business plans, and executive reports.
Usage Points
-
Main Usage
Clearly present five core values of service development strategy through an icon-based flow diagram while visualizing annual performance data with a clustered bar chart, enabling simultaneous communication of strategic direction and quantitative evidence.
-
How to Use
Present the five-step process and objectives on the first slide, then use the second slide's bar chart to compare historical performance against future targets. Ideal for executive briefings, strategic presentations, and investor pitch meetings requiring data-driven credibility.
-
Recommended For
Recommended for strategy planning teams, business development departments, marketing teams, and executive reporting. Effective for new service launch announcements, mid-term strategy reviews, investor relations presentations, and organizational strategy alignment meetings.
-
Slide Structure
Slide 1: Five-icon flow diagram with left-to-right linear arrangement and connecting arrows between steps. Slide 2: Clustered bar chart spanning 2022–2030 with four data series (value 01–04) plus right-side text area. 16:9 widescreen format, PPTX file type.
Related Products
-

Future System Differentiation Strategy – Service Development Direction
#Product/Service Introduction #Business Strategy #Diagram
-

Product Value Correlation Slide – Business Insights Through Diagrams
#Product/Service Introduction #Business Strategy #Diagram
-

Research Phase Procedure Plan – Visualizing Step-by-Step Schedule
#Business Strategy #Operational Plan #Diagram
-

Medical Marketing Goals Diagram – Business Strategy and Flow
#Business Strategy #Marketing Plan and Strategy #Diagram
