Product Value Correlation Slide – Business Insights Through Diagrams
RJ0900034_24
- Last Update 08/26/2025
- File Size 0.4MB
- # of Slides 2
- File Format PPTX
- Slide Ratio 16:9
- Color
Keywords
- #Content-Based Slides
- #Design-Based Slides
- #Product/Service Introduction
- #Business Strategy
- #Diagram
- #Differentiation Strategy for Products/Services
- #Step-by-Step Schedule Plan
- #Flow
- #Cluster
- #Linear Flow
- #Inclusive Cluster Diagram
- #16:9
- #nested diagram PowerPoint slide
- #value correlation template
- #business insight presentation
- #process flow diagram
- #circular node slide design
About the Product
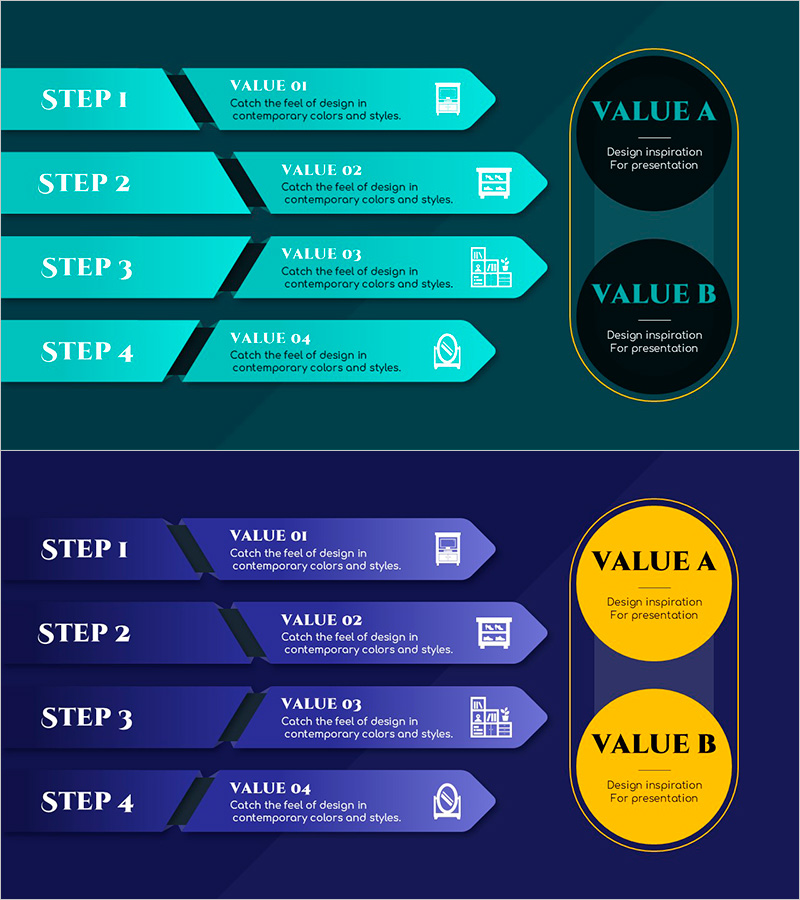
A nested diagram PowerPoint slide that visualizes the correlation between product value and key business elements. This template features two color versions—turquoise and navy blue—each displaying a 4-step process flow on the left with two circular value nodes on the right. Black divider lines and directional arrows clarify the sequential progression and relational connections between value components. Delivered in 16:9 widescreen PPTX format with fully editable elements, this slide deck is ideal for business strategy presentations, product introductions, value proposition pitches, and stakeholder communications.
Usage Points
-
Main Usage
Designed to illustrate the relationship between a product's core value and the factors that influence it. The dual representation of a 4-step process and two value areas enables clear communication of complex business concepts through visual hierarchy and logical flow.
-
How to Use
Input process steps or implementation phases in the left-side arrow boxes, and enter core values or expected outcomes in the right-side circular nodes. Select the color version that matches your presentation tone. All text, icons, and shapes are fully customizable within PowerPoint.
-
Recommended For
Product strategy presentations, executive business reports, marketing strategy decks, investment pitch decks, consulting proposal slides, and organizational value communication materials.
-
Slide Structure
Two-slide set. Top slide features turquoise background with four left-aligned arrow boxes (STEP 1–4) and two right-aligned circular nodes (VALUE A and B). Bottom slide uses navy blue background with identical layout but yellow-highlighted nodes. Each arrow box includes an icon placeholder for visual enhancement.
Related Products
-

Construction Strategy Diagram – Business Vision and Differentiation Strategy
#Product/Service Introduction #Business Vision and Strategy #Diagram
-

Understanding Diagram of Camping Isometric Business – Product Differentiation Strategy
#Product/Service Introduction #Diagram #Differentiation Strategy for Products/Services
-

Visualizing Future Service Development Procedures – Strategies for Innovation
#Product/Service Introduction #Business Strategy #Diagram
-

Future System Differentiation Strategy – Service Development Direction
#Product/Service Introduction #Business Strategy #Diagram
