Artificial Intelligence Big Data System Process – Business Strategy Diagram
RJ0400059_26
- Last Update 06/03/2025
- File Size 3.1MB
- # of Slides 2
- File Format PPTX
- Slide Ratio 16:9
- Color
Keywords
- #Content-Based Slides
- #Design-Based Slides
- #Business Strategy
- #Operational Plan
- #Diagram
- #Step-by-Step Schedule Plan
- #Business Processes
- #Flow
- #Linear Flow
- #16:9
- #linear diagram PowerPoint
- #process flow slide template
- #AI system diagram
- #4-stage process flow
- #business implementation strategy slide
- #technology roadmap diagram PowerPoint
About the Product
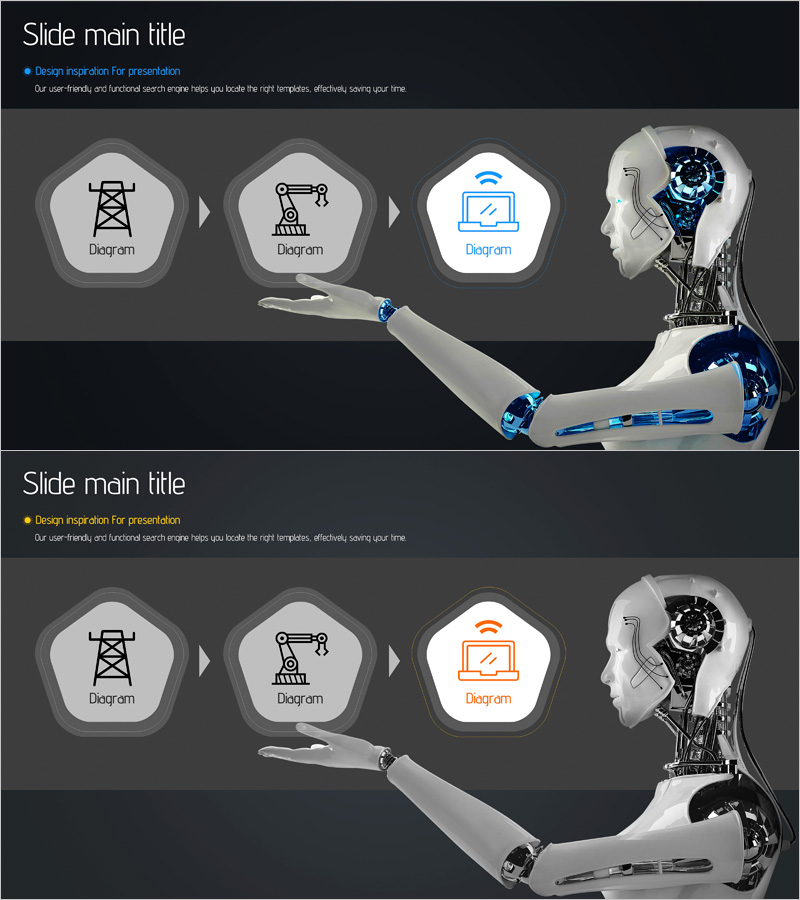
A PowerPoint slide that visualizes the implementation strategy of artificial intelligence and big data systems through a 4-stage linear process flow. The slide features power grid, manufacturing robot, and laptop icons connected by arrows from left to right, with each stage represented as a hexagonal node for clear information delivery. Against a dark gray background, white and blue accent colors emphasize technical credibility, making it ideal for explaining business implementation phases, technology roadmaps, and system deployment processes. The 2-slide set includes color variations (blue and orange) that can be selected based on presentation context.
Usage Points
-
Main Usage
Explain artificial intelligence and big data technology adoption processes stage-by-stage, conveying the business implementation strategy flow intuitively to audiences. Represent technology planning, system deployment, and operational phases sequentially to simplify complex technical concepts and enhance credibility.
-
How to Use
Use in technology presentations, business briefings, and investment pitch meetings when explaining AI and big data adoption roadmaps. Edit stage text to input company-specific project timelines, milestones, and responsible departments, and customize icons to create industry-specific process flows.
-
Recommended For
Technology planners, business development teams, and data scientists at IT and software companies explaining system adoption strategies. Also effective for executives in consulting, finance, and manufacturing sectors presenting digital transformation roadmaps.
-
Slide Structure
2-slide set. Each slide displays a left-to-right linear flow with 4 hexagonal nodes (power grid, manufacturing robot, laptop, and AI brain icons) connected by arrows. The first slide features blue tones while the second offers orange tones, providing color variations for flexible presentation context selection.
Related Products
-

Green & Gray Template Wide Step Diagram
#Business Strategy #Operational Plan #Diagram
-

3D Diagram of the 3-Step Process
#Business Strategy #Operational Plan #Diagram
-

Mobile Service Process – Stepwise Operation Strategy
#Business Strategy #Operational Plan #Diagram
-

Step-by-step Introduction Page – Business Strategy and Operational Planning
#Business Strategy #Operational Plan #Diagram
