Business Direction Strategy Structure Diagram – Visual Planning for Business Efficiency
RM0200008_19
- Last Update 02/03/2025
- File Size 1MB
- # of Slides 2
- File Format PPTX
- Slide Ratio 16:9
- Color
Keywords
- #Content-Based Slides
- #Design-Based Slides
- #Business Vision and Strategy
- #Marketing Plan and Strategy
- #Diagram
- #Business Strategy
- #Marketing Strategy
- #Flow
- #Circular Flow
- #16:9
- #cycle diagram PowerPoint
- #4-stage circular flow slide
- #business strategy diagram
- #cyclical process template
- #business cycle PPT slide
About the Product
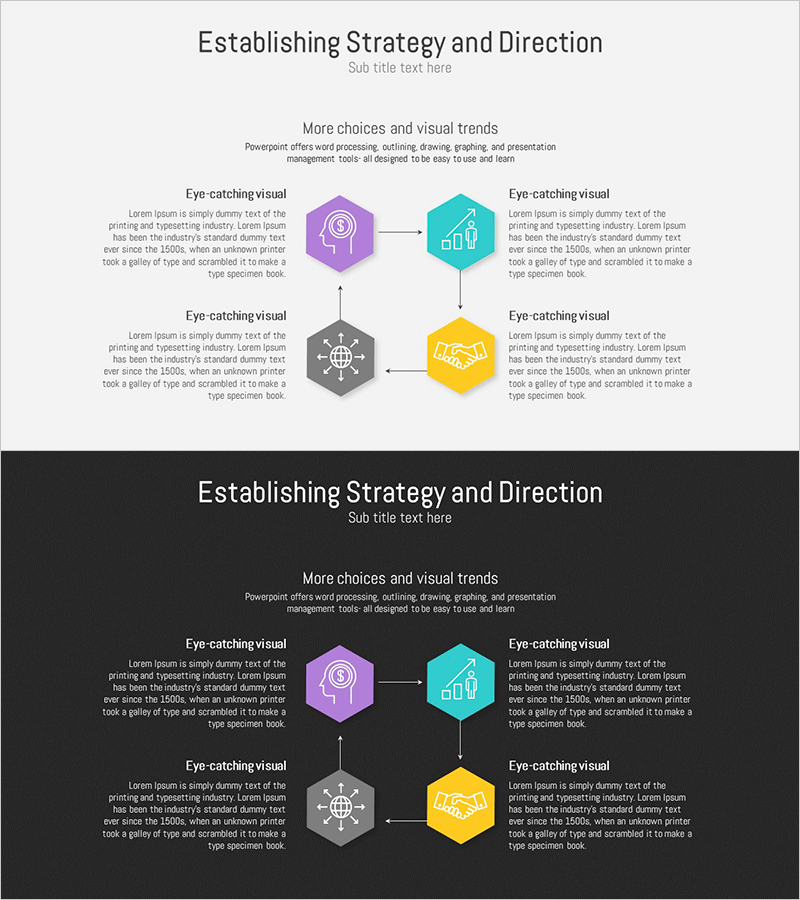
A PowerPoint slide that visualizes business direction and strategy through a 4-stage circular structure. Four hexagonal nodes (finance, chart, network, handshake) are connected by arrows from a central hub, expressing cyclical business planning for operational efficiency. Four distinct colors—purple, teal, gray, and yellow—differentiate each stage, while clear arrow flows convey process progression intuitively. The 2-slide set includes both light and dark background versions to adapt to various presentation environments. Fully editable in PPTX format for immediate customization.
Usage Points
-
Main Usage
Visualizes business strategy as a 4-stage cyclical process, breaking down funding, performance analysis, network building, and partnership development into distinct phases. The arrow flow from the central hub emphasizes continuous circular structure and iterative business cycles.
-
How to Use
Use in business plans, strategy presentations, and executive reports within the strategy development section. Edit hexagon text to reflect actual business phases, and add icons to reinforce stage meanings. Light background suits standard presentations; dark background works for evening events and projector environments.
-
Recommended For
Executives, business planners, strategy consultants, and marketing professionals explaining business cycles and circular processes. Particularly effective for startup pitches, corporate strategy meetings, and organizational improvement project presentations.
-
Slide Structure
2-slide set. Each slide features a central hub with 4 hexagonal nodes positioned at top, right, bottom, and left, connected by arrows showing clockwise circular flow. Each node contains icon and text input areas, with colors differentiated by stage.
Related Products
-

7P Marketing Overlay Diagram – Innovation in Business Strategy
#Business Vision and Strategy #Marketing Plan and Strategy #Diagram
-

Piece Arrow Shape Circular Diagram – Business Strategy Representation
#Business Vision and Strategy #Marketing Plan and Strategy #Diagram
-

Business Strategy Cycle Diagram – Effective Business Strategy Representation
#Business Vision and Strategy #Marketing Plan and Strategy #Diagram
-

Marketing Strategy Cycle Diagram – Effective Strategy Visualization
#Business Vision and Strategy #Marketing Plan and Strategy #Diagram
