Marketing Strategy Cycle Diagram – Effective Strategy Visualization
RM0400003_22
- Last Update 02/14/2025
- File Size 3.6MB
- # of Slides 2
- File Format PPTX
- Slide Ratio 16:9
- Color
Keywords
- #Content-Based Slides
- #Design-Based Slides
- #Business Vision and Strategy
- #Marketing Plan and Strategy
- #Diagram
- #Business Strategy
- #Marketing Strategy
- #Flow
- #Circular Flow
- #16:9
- #cycle diagram PowerPoint
- #marketing strategy slide
- #3-step circular diagram
- #marketing plan template
- #strategy visualization PPT
About the Product
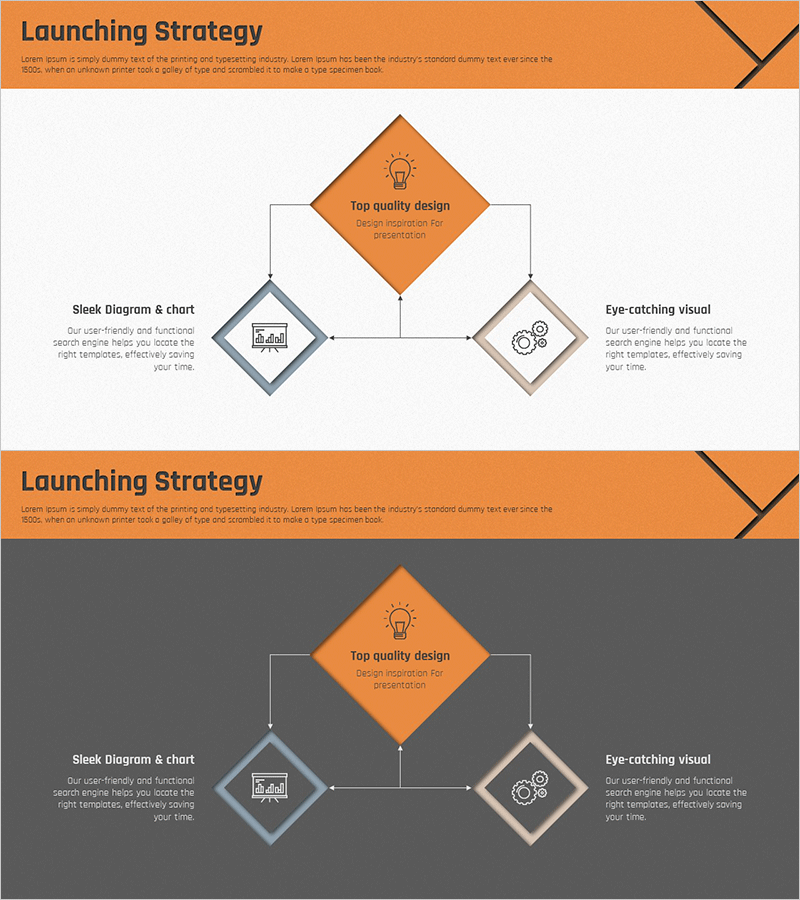
A PowerPoint slide that visualizes the marketing strategy implementation process through a 3-step circular structure. The central strategy element (top quality design) connects to left diagram & chart and right visual elements in a radial pattern, clearly expressing the interaction between strategic components. The color scheme combines orange as the primary tone with gray and beige accents, creating a professional yet visually impactful presentation. Each node includes icon and text areas for detailing marketing planning, strategy execution, and performance measurement. The 16:9 widescreen format with 2-slide composition is ready for immediate use in presentations, business plans, and marketing strategy documents.
Usage Points
-
Main Usage
This slide effectively communicates the cyclical execution process of marketing strategy. The 3-step cycle of planning→execution→evaluation is represented through a central hub with radiating elements, emphasizing connectivity and repetition between stages. It enhances message delivery in executive briefings, team meetings, and marketing strategy presentations.
-
How to Use
Enter the core strategy name in the central orange diagram and detail execution items in the left gray and right beige nodes. Customize node icons to match strategy characteristics or expand text areas for additional descriptions. Colors can be maintained or changed to company brand colors. Use the 2-slide composition with the first slide for overview and the second for detailed explanation.
-
Recommended For
Marketing managers, business planning teams, executives, marketing consultants, and advertising agency strategists preparing marketing plans, business proposals, quarterly strategy reports, and new campaign pitches. Particularly effective when explaining cyclical processes or interconnected strategic elements.
-
Slide Structure
2-slide composition with the first slide featuring a light background containing a central orange diagram (1 node) connected via horizontal arrows to left gray and right beige diagrams (1 node each) in a 3-node structure. The second slide repeats the same structure on a dark background, providing color variation options. Each node consists of an icon area and text input field.
Related Products
-

5P Marketing Analysis Graph – Effective Strategy Design
#Business Vision and Strategy #Marketing Plan and Strategy #Diagram
-

7P Marketing Overlay Diagram – Innovation in Business Strategy
#Business Vision and Strategy #Marketing Plan and Strategy #Diagram
-

Strategic Flow Cycle Diagram – Strong Visual for Business Vision
#Business Vision and Strategy #Marketing Plan and Strategy #Diagram
-

Space Business Strategy Connection Diagram – Vision of Innovation
#Business Vision and Strategy #Marketing Plan and Strategy #Diagram
