Business Strategy Cycle Diagram – Effective Business Strategy Representation
RJ0300056_15
- Last Update 05/03/2025
- File Size 5.6MB
- # of Slides 2
- File Format PPTX
- Slide Ratio 16:9
- Color
Keywords
- #Content-Based Slides
- #Design-Based Slides
- #Business Vision and Strategy
- #Marketing Plan and Strategy
- #Diagram
- #Business Strategy
- #Marketing Strategy
- #Flow
- #Circular Flow
- #16:9
- #circular diagram PowerPoint
- #business strategy slide template
- #2-step cycle diagram
- #marketing process PPT
- #arrow diagram PowerPoint slide
- #how to create cycle diagram in PowerPoint
About the Product
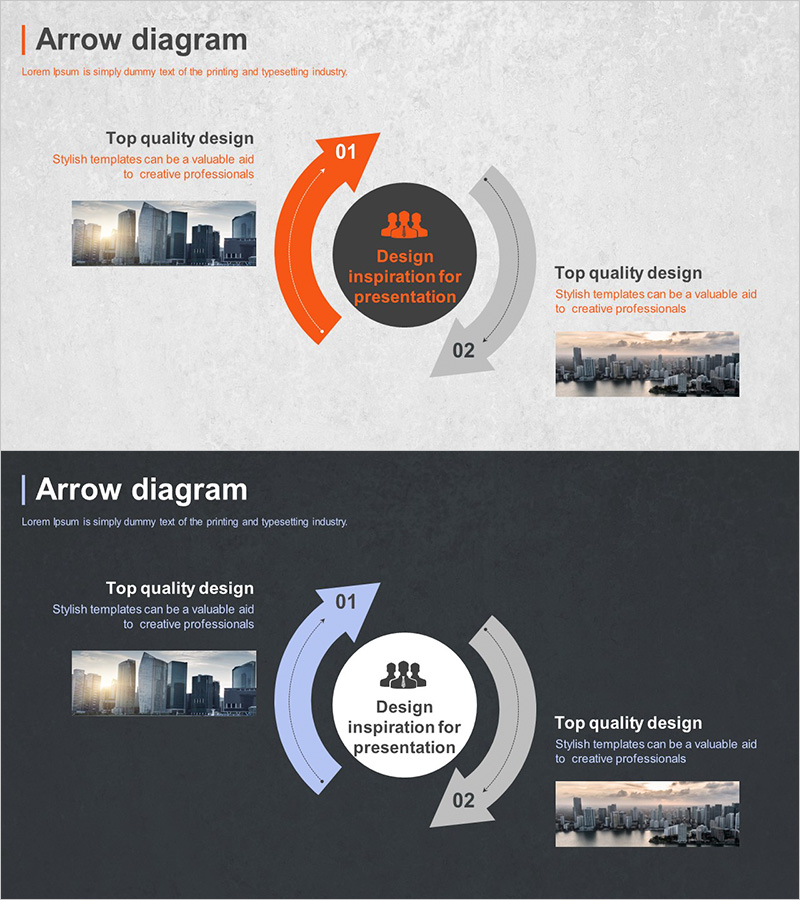
A professional circular diagram PowerPoint slide designed for business strategy and marketing planning presentations. The two-step cycle flows clockwise around a central message hub, with orange and gray directional arrows representing continuous process, iterative strategy, and feedback loops. Each stage includes dedicated image and text areas for detailed explanations. The 16:9 widescreen format with 2-slide composition enables immediate editing and deployment in executive presentations, strategic planning sessions, and business development meetings.
Usage Points
-
Main Usage
Visualizes cyclical business processes, marketing strategies, and operational workflows. The two-stage circular flow centered on a core message hub effectively communicates iterative improvement, continuous execution, and feedback-driven strategy cycles in business and marketing contexts.
-
How to Use
Enter strategy phase names in each arrow segment and insert relevant images or icons in the left and right image placeholders. Add your core objective or vision statement in the central circular hub to emphasize the strategic center. Customize the orange and gray color scheme to match your corporate brand guidelines.
-
Recommended For
Executive strategy presentations, quarterly and annual business planning reports, marketing campaign process explanations, organizational improvement cycle sharing, and strategic roadmap communications. Suitable for consulting, finance, manufacturing, IT, and other industries requiring visual strategy representation.
-
Slide Structure
2-slide set. Slide 1: Light gray background with orange arrow (Stage 01) and gray arrow (Stage 02) arranged clockwise around a central circular hub. Image placeholders positioned left and right of each stage. Slide 2: Dark charcoal background with lavender-toned and gray arrows in identical circular layout. Both slides in 16:9 widescreen format with consistent design language.
Related Products
-

Space Business Strategy Connection Diagram – Vision of Innovation
#Business Vision and Strategy #Marketing Plan and Strategy #Diagram
-

Piece Arrow Shape Circular Diagram – Business Strategy Representation
#Business Vision and Strategy #Marketing Plan and Strategy #Diagram
-

Business Strategy Direction Diagram – Establishing Business Vision
#Business Vision and Strategy #Marketing Plan and Strategy #Diagram
-

5P Marketing Mix Circular Diagram - Visualizing Business Strategies
#Business Vision and Strategy #Marketing Plan and Strategy #Diagram
