Market Analysis Pie Chart – Vibrant Visualization in Contemporary Colors
RM0200008_14
- Last Update 02/03/2025
- File Size 1MB
- # of Slides 2
- File Format PPTX
- Slide Ratio 16:9
- Color
Keywords
- #Content-Based Slides
- #Design-Based Slides
- #Product/Service Introduction
- #Market and Competitor Analysis
- #Diagram
- #Graph
- #Development Status
- #Market Analysis
- #Cluster
- #Circles
- #Closed Cluster Diagram
- #Pie Chart
- #16:9
- #pie chart PowerPoint
- #circular graph template
- #market analysis slide
- #data ratio visualization
- #4-segment chart download
About the Product
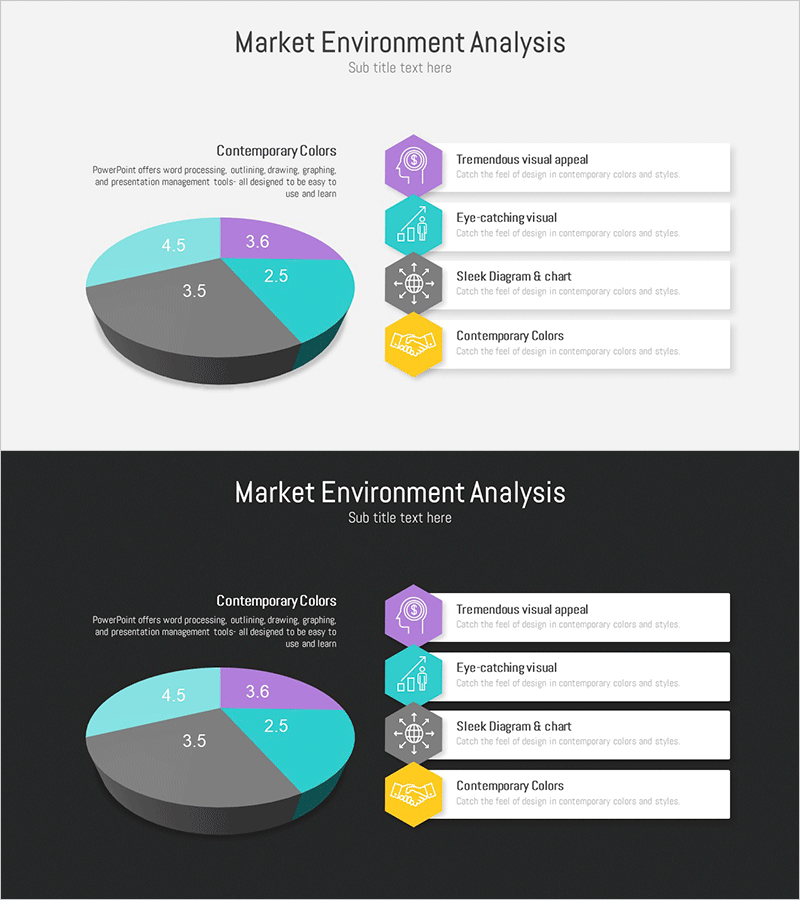
A professional pie chart PowerPoint slide designed for market analysis and business performance visualization. This circular graph divides data into 4 segments using contrasting teal, purple, gray, and dark tones that clearly distinguish each section. The 3D effect adds visual depth and engagement, while icon-based legend on the right side intuitively conveys the meaning of each segment. The 2-slide set includes both light and dark background versions, allowing you to choose based on your presentation environment. Fully editable in PowerPoint format—simply modify values and labels to match your data.
Usage Points
-
Main Usage
Presents market share, composition ratios, and segment distribution at a glance. The circular format makes it easy for audiences to understand the relative proportion of each segment compared to the whole. Ideal for visualizing ratio-based data in marketing strategies, business analysis, and financial reports.
-
How to Use
Double-click the values and labels within the slide to edit them. Pie segment sizes automatically adjust to match your data ratios, and colors can be modified via the Design tab. Use the light background version for daytime presentations and printing; the dark background works best for evening presentations and projector environments.
-
Recommended For
Marketing professionals, executives, analysts, and consultants explaining market analysis, business performance, and financial composition. Suitable for business plans, investor pitch decks, quarterly reports, marketing proposals, and corporate presentations.
-
Slide Structure
A 4-segment 3D pie chart positioned on the left, with 4 colored hexagon icons (purple, teal, gray, yellow) and corresponding text labels arranged vertically on the right. Each legend item includes a description text field for additional information.
Related Products
-

Current Status Analysis Pie Chart – Insights for Market Analysis
#Product/Service Introduction #Market and Competitor Analysis #Diagram
-

Watch Shape Market Share Graph – Data Visualization and Analysis
#Product/Service Introduction #Market and Competitor Analysis #Diagram
-

Clock Shape Circular Diagram – Product and Market Analysis
#Product/Service Introduction #Market and Competitor Analysis #Graph
-

Online Presentation Template - Pie Chart & Radar Chart
#Product/Service Introduction #Market and Competitor Analysis #Graph
