Current Status Analysis Pie Chart – Insights for Market Analysis
RJ0300090_19
- Last Update 05/14/2025
- File Size 0.3MB
- # of Slides 2
- File Format PPTX
- Slide Ratio 16:9
- Color
Keywords
- #Content-Based Slides
- #Design-Based Slides
- #Product/Service Introduction
- #Market and Competitor Analysis
- #Diagram
- #Graph
- #Development Status
- #Market Analysis
- #Cluster
- #Circles
- #Closed Cluster Diagram
- #Pie Chart
- #16:9
- #pie chart PowerPoint
- #pie graph template
- #4-segment pie chart slide
- #market analysis chart
- #data visualization PPT
- #business status presentation
About the Product
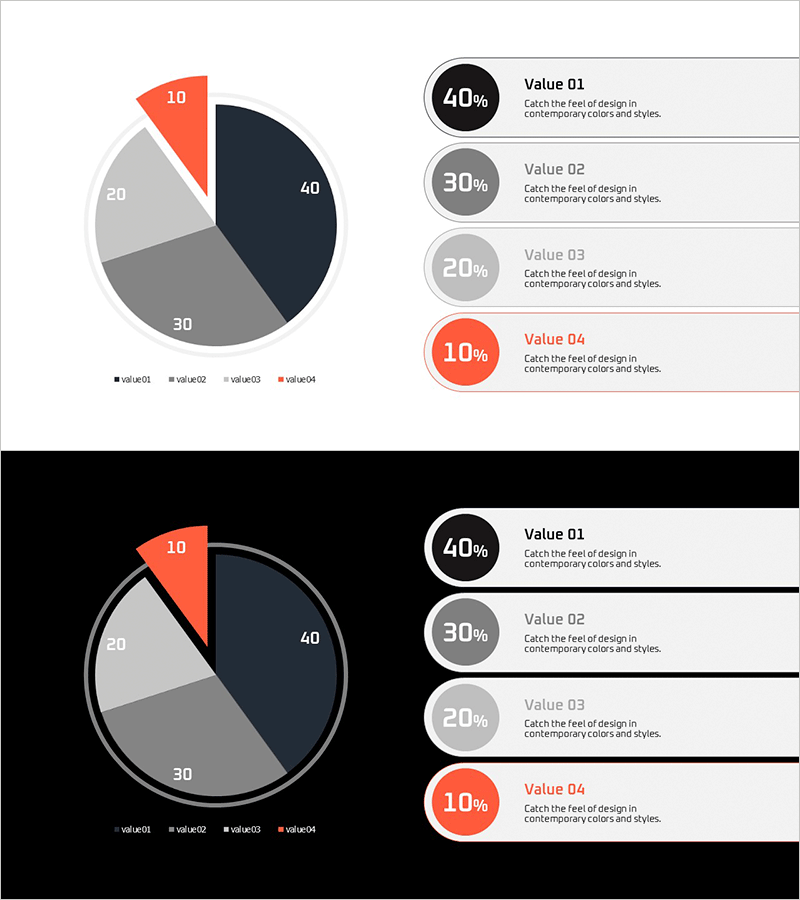
A professional pie chart PowerPoint slide designed for market analysis and business status reporting. The template features a 4-segment circular chart with distinct navy, gray, and coral color coding for clear data differentiation. Each segment displays percentage values and corresponding legend items on the right side for easy interpretation. Two slide layouts are included—one with a light background and one with a dark background—allowing you to choose the best option for your presentation environment. Ideal for visualizing market share, customer composition, budget allocation, and business performance metrics in reports and presentations.
Usage Points
-
Main Usage
Visualizes four-category ratio data such as market share, customer segments, budget distribution, and business performance using a circular chart format. Each segment is color-coded for clarity and labeled with percentage values, enabling audiences to quickly understand data proportions and relationships.
-
How to Use
Insert this slide in the business overview or market analysis section of your presentation. Replace the default text and percentage values with your actual data, then select either the light background version for daytime presentations and printing, or the dark background version for evening presentations and screen projection.
-
Recommended For
Marketing professionals, executives, consultants, and business analysts presenting market analysis, business status, and customer segmentation data. Suitable for investor presentations, board meetings, client proposals, and quarterly business reviews where ratio-based insights need clear visual communication.
-
Slide Structure
Two-slide layout featuring identical 4-segment pie chart designs in contrasting backgrounds. Each slide contains a left-aligned circular chart (divided into 40%, 30%, 20%, and 10% segments) paired with a right-side legend and description area for data labels and explanatory text.
Related Products
-

Watch Shape Market Share Graph – Data Visualization and Analysis
#Product/Service Introduction #Market and Competitor Analysis #Diagram
-

Market Analysis Pie Chart – Vibrant Visualization in Contemporary Colors
#Product/Service Introduction #Market and Competitor Analysis #Diagram
-

Pie Chart of Shooting Status Analysis – Visual Insights
#Product/Service Introduction #Market and Competitor Analysis #Diagram
-

Animal Trait Distribution Pie Chart – Market and Competitor Analysis
#Market and Competitor Analysis #Diagram #Graph
