Company History Diagram – Capturing the Flow of Development
RM0200007_5
- Last Update 02/03/2025
- File Size 1.1MB
- # of Slides 2
- File Format PPTX
- Slide Ratio 16:9
- Color
Keywords
About the Product
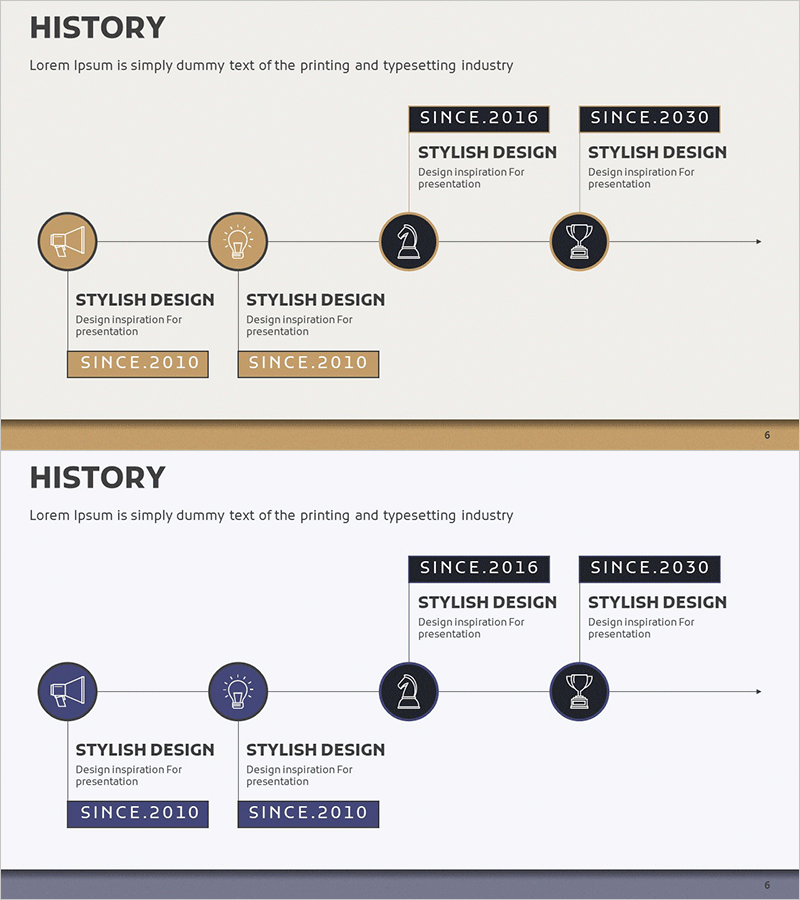
A 4-stage linear timeline diagram PowerPoint slide designed to visualize company development and milestones in chronological order. The left-to-right arrow-connected structure clearly shows corporate history, key achievements, and growth phases. Icon nodes in beige, brown, black, and navy tones combined with text boxes allow you to present specific dates, events, and descriptions for each period. The 2-slide set offers multiple color scheme options and is optimized for 16:9 widescreen format in PPTX. Perfect for investor presentations, company profiles, annual reports, and business development materials to effectively communicate your organization's growth trajectory.
Usage Points
-
Main Usage
Designed to present your company's historical development in chronological sequence. Organize founding date, major milestones, business expansion phases, and technology innovations across 4 distinct nodes. Helps audiences quickly grasp your organization's growth story and competitive positioning over time.
-
How to Use
Enter dates, event names, and achievement descriptions in each node's icon and text box. The left-to-right arrow flow automatically conveys chronological progression, making the timeline intuitive for viewers. Simply edit text while maintaining the color scheme for immediate use in presentations.
-
Recommended For
Ideal for investor relations presentations, company profiles, annual reports, business development pitches, employee onboarding materials, and corporate communications. Recommended for executives, marketing teams, corporate communications departments, and business development professionals presenting company growth narratives.
-
Slide Structure
2-slide set with different color schemes. Each slide features 4 circular icon nodes connected by left-to-right arrows, text boxes below each node, and connecting lines. Slide 1 uses beige and brown tones; Slide 2 uses black and navy tones, allowing you to select the palette matching your presentation theme.
Related Products
-

History Gradient Diagram – Flow of Business Strategy
#Company Introduction #Business Strategy #Diagram
-

Achievements Timeline Diagram – Business Vision and Strategy
#Company Introduction #Business Vision and Strategy #Diagram
-

List of Studies by Year Slide – Business Strategy and Vision
#Company Introduction #Business Vision and Strategy #Diagram
-

History Vertical Arrow Diagram – Business Flow Visualization
#Company Introduction #Diagram #History
