List of Studies by Year Slide – Business Strategy and Vision
RJ0700028_17
- Last Update 07/30/2025
- File Size 0.8MB
- # of Slides 2
- File Format PPTX
- Slide Ratio 16:9
- Color
Keywords
- #Content-Based Slides
- #Design-Based Slides
- #Company Introduction
- #Business Vision and Strategy
- #Diagram
- #History
- #Business Goals
- #Flow
- #Cluster
- #Linear Flow
- #Chain Diagram
- #16:9
- #timeline diagram PowerPoint
- #connection diagram slide
- #year-by-year presentation
- #business strategy slide template
- #milestone PowerPoint slide
About the Product
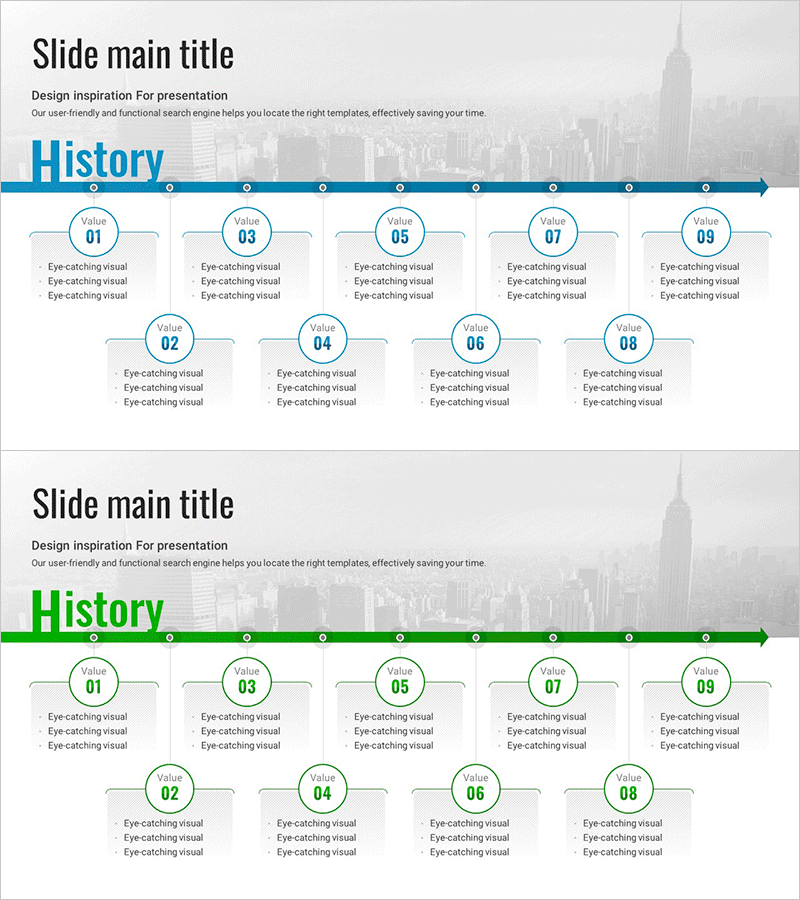
A timeline connection diagram PowerPoint slide that visualizes year-by-year research lists and business strategy progression. Available in two color schemes—blue and green—with nine circular nodes sequentially connected along a horizontal arrow. Each node accommodates year, stage, or item labels, with detailed description areas positioned below. This presentation template is ready to use for business strategy, company history, research progress tracking, project milestones, and any initiative requiring chronological visualization.
Usage Points
-
Main Usage
Ideal for visualizing year-by-year progress, business strategy phases, company history, project milestones, and research advancement. Each stage's key achievements and objectives fit into circular nodes, while the description area below conveys detailed information for each phase.
-
How to Use
Enter year, stage name, or item label in each circular node, then add key content, achievements, or objectives in the text box below. Select either the blue or green version to match your corporate brand color. With 2 slides included, you can represent multiple timelines consecutively.
-
Recommended For
Executives, business managers, marketing teams, R&D departments, and project managers presenting business plans, research progress, organizational history, product development roadmaps, or strategic execution plans. Suitable for investor pitch decks, business reports, strategy presentations, and annual reports.
-
Slide Structure
Nine circular nodes arranged alternately above and below a horizontal arrow centerline. Each node contains a circular area for numbering or year display plus three lines of descriptive text. The layout emphasizes left-to-right linear progression, with a semi-transparent cityscape background enhancing the professional context.
Related Products
-

Timeline Diagram for Business Goals and Schedule – Journey to Achieve Vision
#Company Introduction #Business Vision and Strategy #Diagram
-

Adventure Company History 4 Color Connection Diagram
#Company Introduction #Business Strategy #Diagram
-

Scientific Experiment History Diagram – Journey of Research and Innovation
#Company Introduction #Diagram #History
-

Diagram Slide Visualizing Orange & Green Future Goals
#Company Introduction #Business Vision and Strategy #Diagram
