Expected Effects Based on Market Analysis – Insights Visualized by Data
RM0200006_11
- Last Update 02/02/2025
- File Size 1MB
- # of Slides 2
- File Format PPTX
- Slide Ratio 16:9
- Color
Keywords
- #Content-Based Slides
- #Design-Based Slides
- #Business Strategy
- #Market and Competitor Analysis
- #Diagram
- #Graph
- #Financial Outlook & Expected Impact
- #Market Analysis
- #Cluster
- #Closed Cluster Diagram
- #16:9
- #line chart PowerPoint slide
- #multi-series trend analysis
- #data visualization presentation
- #expected effects chart
- #market analysis graph template
About the Product
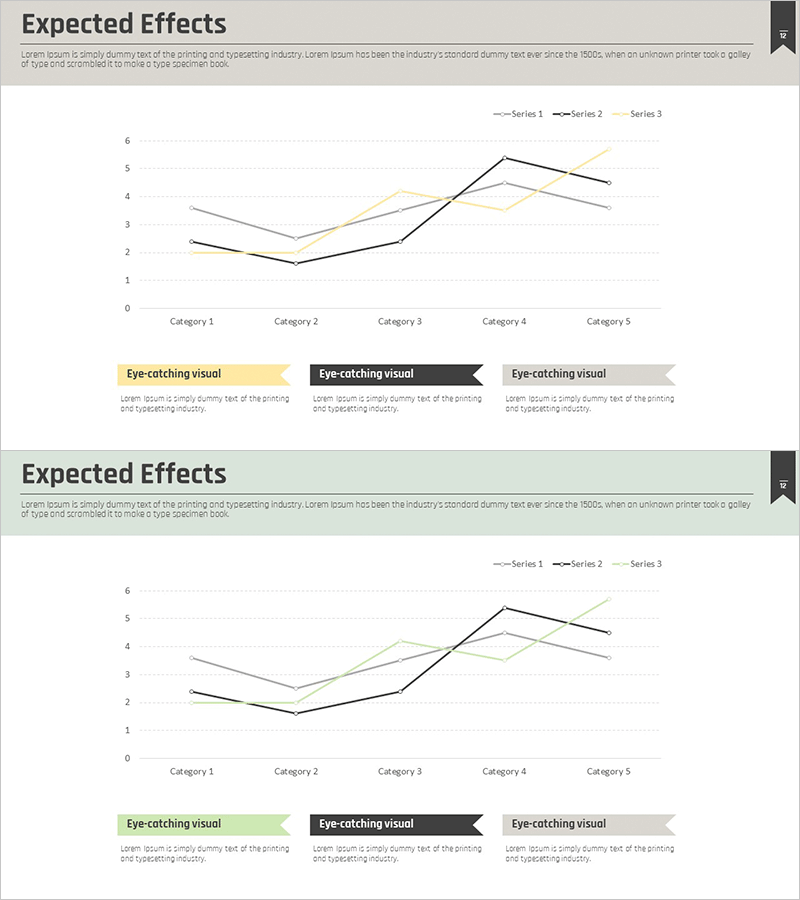
A professional line chart PowerPoint slide designed for market analysis and business strategy presentations. This slide visualizes three data series across five categories to clearly communicate expected effects and revenue projections. The chart uses contrasting gray, black, and yellow lines to make trend comparisons intuitive and easy to follow. Three highlight boxes at the bottom allow you to summarize key insights and strategic takeaways. In 16:9 widescreen format with 2 slides, this fully editable presentation template is ready to use in business reports, proposals, and investor pitch decks.
Usage Points
-
Main Usage
This slide presents market analysis results and expected effects using three comparable data series across five categories. The line chart format effectively displays trend changes and allows stakeholders to understand projected business outcomes through clear, data-driven visualization.
-
How to Use
Simply replace the line colors and data points with your own figures. Edit the three highlight boxes below the chart to include key insights, strategic directions, and expected outcomes. This slide integrates seamlessly into business reports, proposals, marketing plans, and investor presentations.
-
Recommended For
Ideal for business managers, marketing strategists, and consultants who need to present market analysis findings to executives, investors, and clients. Perfect for business plans, marketing proposals, investor pitch decks, and performance reports where data-backed decision-making is essential.
-
Slide Structure
Title area + multi-series line chart (gray, black, and yellow lines representing three data series; 5 categories on X-axis; 0-6 scale on Y-axis) + three highlight boxes at bottom (yellow, black, and gray backgrounds). The 2-slide set allows the first slide for overall trend analysis and the second for category-specific details or effect summary.
Related Products
-

Donut Chart Comparing Market Share by Coffee Brand
#Market and Competitor Analysis #Diagram #Graph
-

Botanic Garden and Bar Chart – Visualization for Market Analysis
#Market and Competitor Analysis #Diagram #Graph
-

Competitor Comparison Analysis Bar Graph – Data Visualization for Market Analysis
#Market and Competitor Analysis #Diagram #Graph
-

Market Analysis Pie Chart – Vibrant Visualization in Contemporary Colors
#Product/Service Introduction #Market and Competitor Analysis #Diagram
