Halloween Template Radar Chart – Market and Competition Analysis
RJ0500033_25
- Last Update 06/16/2025
- File Size 0.5MB
- # of Slides 2
- File Format PPTX
- Slide Ratio 16:9
- Color
Keywords
- #Content-Based Slides
- #Design-Based Slides
- #Market and Competitor Analysis
- #Diagram
- #Graph
- #Market Analysis
- #Cluster
- #Other
- #Closed Cluster Diagram
- #Radar Chart Spider Chart
- #16:9
- #radar chart PowerPoint
- #5-axis radar chart template
- #market analysis diagram slide
- #competitive analysis PPT
- #Halloween theme PowerPoint slide
- #how to create radar chart in PowerPoint
About the Product
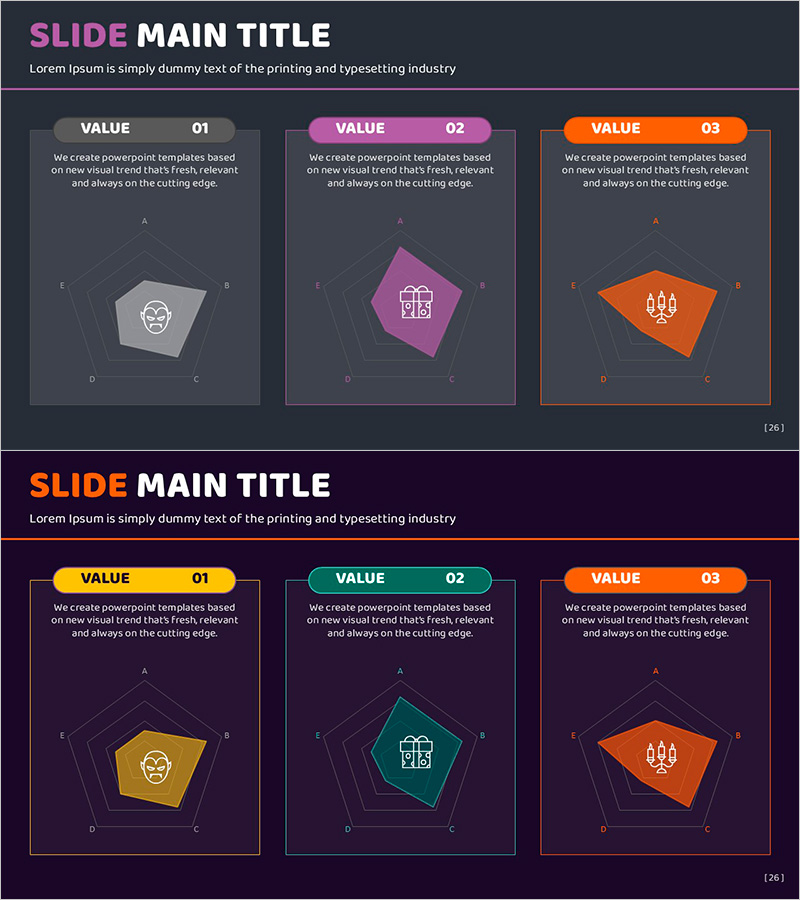
A 5-axis radar chart PowerPoint slide for multi-dimensional comparison and analysis. Designed with purple and orange Halloween theme colors, this template is ready to use for market analysis, competitive benchmarking, capability assessment, and other presentations requiring multi-angle evaluation. The 2-slide set features the first slide with three radar charts on a dark background, and the second slide with yellow, green, and orange accent colors on a deep purple background. Customize axis labels and data values to reflect your actual analysis results, making it ideal for Halloween-themed presentations or thematic corporate pitches.
Usage Points
-
Main Usage
Visualize multi-dimensional comparison of 5 key metrics using a radial radar chart format. Ideal for market analysis presentations comparing competitor strengths and weaknesses, organizational capability assessments across multiple criteria, or any scenario requiring simultaneous evaluation of five factors. Halloween-themed colors add visual interest to seasonal events or themed corporate presentations.
-
How to Use
Input axis labels (e.g., Price, Quality, Technology, Customer Satisfaction, Market Share) and adjust data values for each of the 5 series within a 0-100 range. Use the purple, orange, yellow, and green accent colors to differentiate between competitors or evaluation categories. This color-coded approach helps audiences instantly grasp comparative analysis results.
-
Recommended For
Marketing and strategy teams presenting market analysis, sales teams benchmarking competitors, HR and organizational development teams assessing capabilities, consulting firms analyzing client landscapes, and corporate presentations during Halloween season or themed events.
-
Slide Structure
2-slide set. Slide 1 features a dark gray background with three 5-axis radar charts arranged horizontally, each with labels and descriptive text. Slide 2 displays a deep purple background with three 5-axis radar charts highlighted in yellow, green, and orange to emphasize the Halloween theme. All charts are provided as editable shapes for customization.
Related Products
-

Brain Data Analysis Radial Graph – Insights on Technology and Market
#Market and Competitor Analysis #Diagram #Graph
-

Strategic Direction Diagram through SWOT Analysis
#Market and Competitor Analysis #Diagram #SWOT Analysis
-

Market Share Change Visualized in Donut Chart
#Market and Competitor Analysis #Diagram #Graph
-

SWOT Analysis Closed Diagram – Market and Competitor Analysis Template
#Market and Competitor Analysis #Diagram #SWOT Analysis
