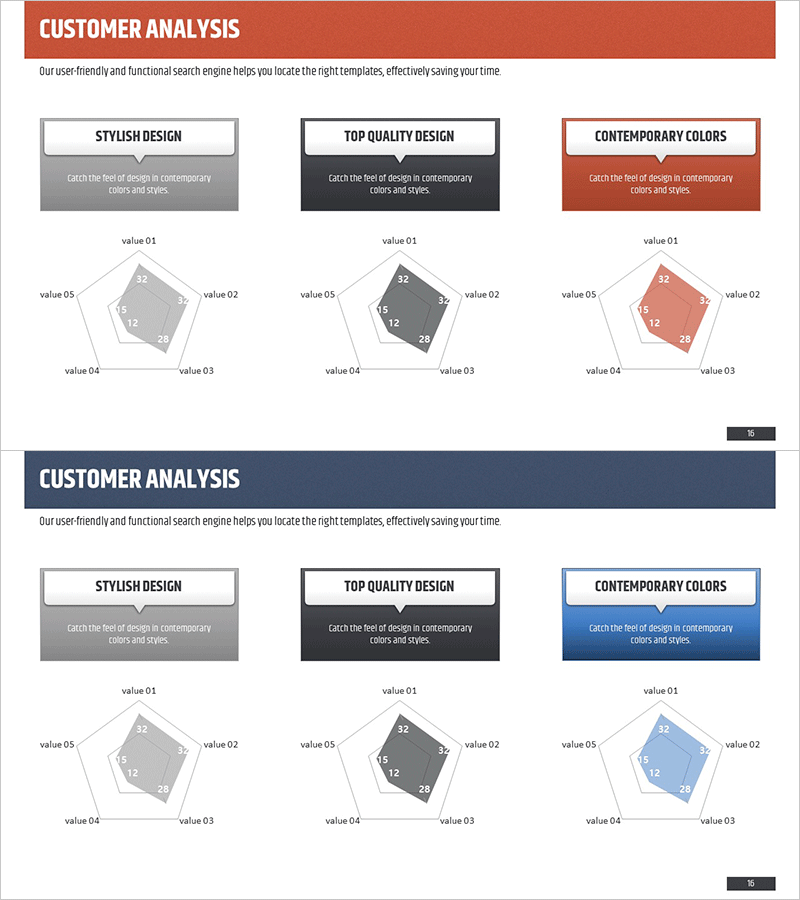
Customer Analysis Radial Graph – Intuitive Data Visualization
RM0200003_15
- Last Update 02/01/2025
- File Size 2.8MB
- # of Slides 2
- File Format PPTX
- Slide Ratio 16:9
- Color
Keywords
- #Content-Based Slides
- #Design-Based Slides
- #Business Introduction
- #Market and Competitor Analysis
- #Diagram
- #Graph
- #Technological Status
- #Customer Analysis
- #Cluster
- #Other
- #Closed Cluster Diagram
- #Radar Chart Spider Chart
- #16:9
- #radial graph PowerPoint
- #customer analysis slide template
- #5-item comparison chart
- #radial diagram PPT
- #data visualization PowerPoint slide
About the Product
A PowerPoint slide set that visualizes customer analysis data using a 5-item radial graph structure. The radial diagram extends from the center outward, allowing intuitive comparison of relative strengths across evaluation dimensions such as stylish design, top quality, and contemporary colors. Three color versions—gray, black, and orange—are included to match your presentation tone. Delivered in 16:9 widescreen format with 2 slides, ready for immediate editing and use in professional presentations.
Usage Points
-
Main Usage
Express relative strengths across five dimensions—customer characteristics, market evaluation, technical status, competitive positioning—in a radial format for instant comprehension. The center-to-outer expansion structure effectively emphasizes competitive advantages and key performance indicators.
-
How to Use
Apply to marketing strategy presentations, market analysis reports, technology status briefings, and customer satisfaction assessments. Each data point updates the radial graph automatically when values are entered, streamlining the editing process.
-
Recommended For
Marketing managers, strategy planners, sales directors, consultants, and analysts benefit from this template when visualizing customer insights, competitive analysis, and performance metrics. Suitable for internal meetings, client presentations, and strategic planning sessions.
-
Slide Structure
Five data points (value 01–05) arranged radially from center to outer edges. Each item includes a numeric input field. Three color variants—gray, black, orange—are provided as separate slides. Two-slide layout supports comparative analysis and multi-scenario presentations.
Related Products
-

Pentagon Radial Graph & Table – Visualizing Customer Analysis
#Business Introduction #Market and Competitor Analysis #Diagram
-

User Feedback Analysis – Visual Insights Centered on Customers
#Market and Competitor Analysis #Customer Success Stories #Diagram
-

User Analysis Radial Graph – Understanding and Analyzing Customers
#Product/Service Introduction #Market and Competitor Analysis #Diagram
-

Visualizing Research and Development Progress – Technical Insights
#Business Introduction #Diagram #Graph
