Pentagon Radial Graph & Table – Visualizing Customer Analysis
RM0200014_15
- Last Update 02/05/2025
- File Size 0.3MB
- # of Slides 2
- File Format PPTX
- Slide Ratio 16:9
- Color
Keywords
- #Content-Based Slides
- #Design-Based Slides
- #Business Introduction
- #Market and Competitor Analysis
- #Diagram
- #Graph
- #Technological Status
- #Customer Analysis
- #Table
- #Other
- #Radar Chart Spider Chart
- #16:9
- #pentagon radial graph PowerPoint
- #5-axis diagram slide
- #comparative analysis chart template
- #customer analysis presentation
- #data visualization slide download
About the Product
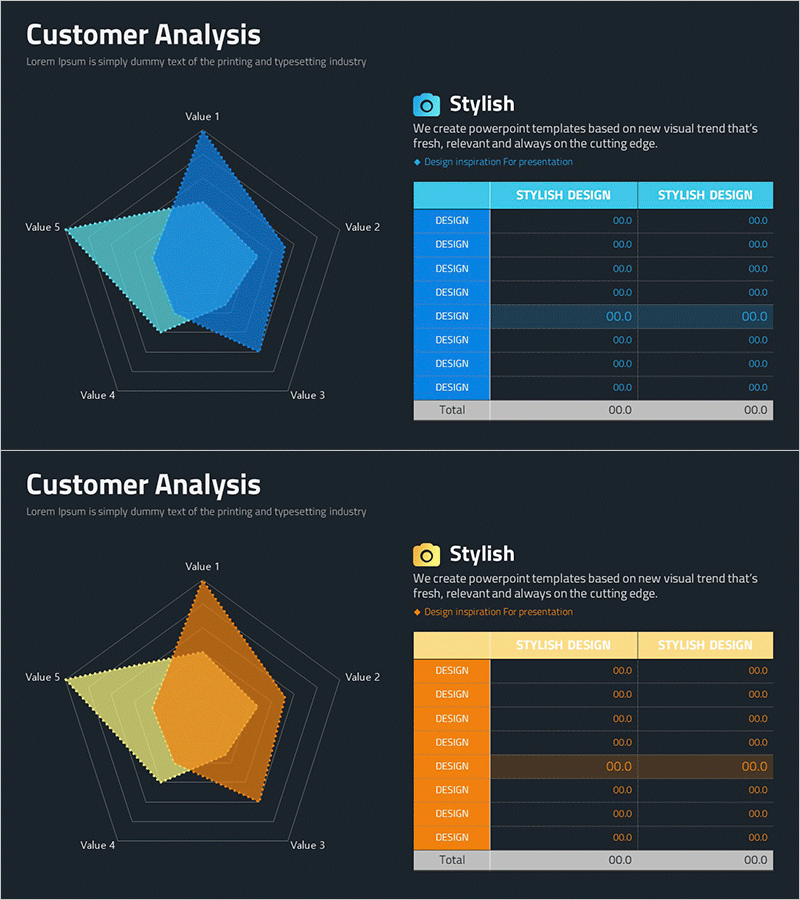
A PowerPoint slide combining a five-axis radial diagram with a data table for multi-dimensional comparison. Ideal for customer analysis, market research, and performance evaluation presentations. The slide features a gradient fill using cyan and lime green to highlight data hierarchy, with a structured table on the right for numerical reference. Fully editable shapes allow quick customization in PowerPoint. Perfect for business reports, marketing proposals, strategy presentations, and stakeholder briefings where multiple metrics need simultaneous visualization.
Usage Points
-
Main Usage
Visualize and compare five key metrics or dimensions in a single view. Commonly used for customer segmentation analysis, competitive benchmarking, product performance assessment, organizational capability mapping, and strategic positioning.
-
How to Use
Input numerical values for each of the five axes in the radial diagram; the shape automatically scales to represent the data. Complete the accompanying table with detailed figures for reference during presentation. Use color layers to distinguish priority levels or categories.
-
Recommended For
Marketing managers, executives, management consultants, data analysts, and sales directors presenting customer insights, market positioning, or performance metrics. Suitable for strategy meetings, executive dashboards, investor pitches, and competitive analysis reports.
-
Slide Structure
Two-slide set in 16:9 widescreen format (PPTX). Slide 1: Title + five-axis pentagon radial diagram with cyan-to-lime gradient + right-aligned data table (8 rows × 3 columns). Slide 2: Identical layout with orange-to-yellow color scheme. All shapes fully editable.
Related Products
-

Camping Competitor Characteristic Analysis Pentagon Graph
#Market and Competitor Analysis #Diagram #Graph
-

Goal Setting & Radial Graph – Intuitive Data Visualization
#Business Introduction #Market and Competitor Analysis #Diagram
-

Customer Analysis Radial Graph – Intuitive Data Visualization
#Business Introduction #Market and Competitor Analysis #Diagram
-

Art and Science Radar Charts – Visual Data Analysis
#Market and Competitor Analysis #Diagram #Graph
