User Feedback Analysis – Visual Insights Centered on Customers
RM0200010_15
- Last Update 02/04/2025
- File Size 1.5MB
- # of Slides 2
- File Format PPTX
- Slide Ratio 16:9
- Color
Keywords
- #Content-Based Slides
- #Design-Based Slides
- #Market and Competitor Analysis
- #Customer Success Stories
- #Diagram
- #Graph
- #Customer Analysis
- #Customer Testimonials and Feedback
- #Cluster
- #Other
- #Closed Cluster Diagram
- #Radar Chart Spider Chart
- #16:9
- #radial diagram PowerPoint slide
- #customer feedback analysis template
- #5-point diagram presentation
- #how to create radial chart in PowerPoint
- #customer analysis slide design
About the Product
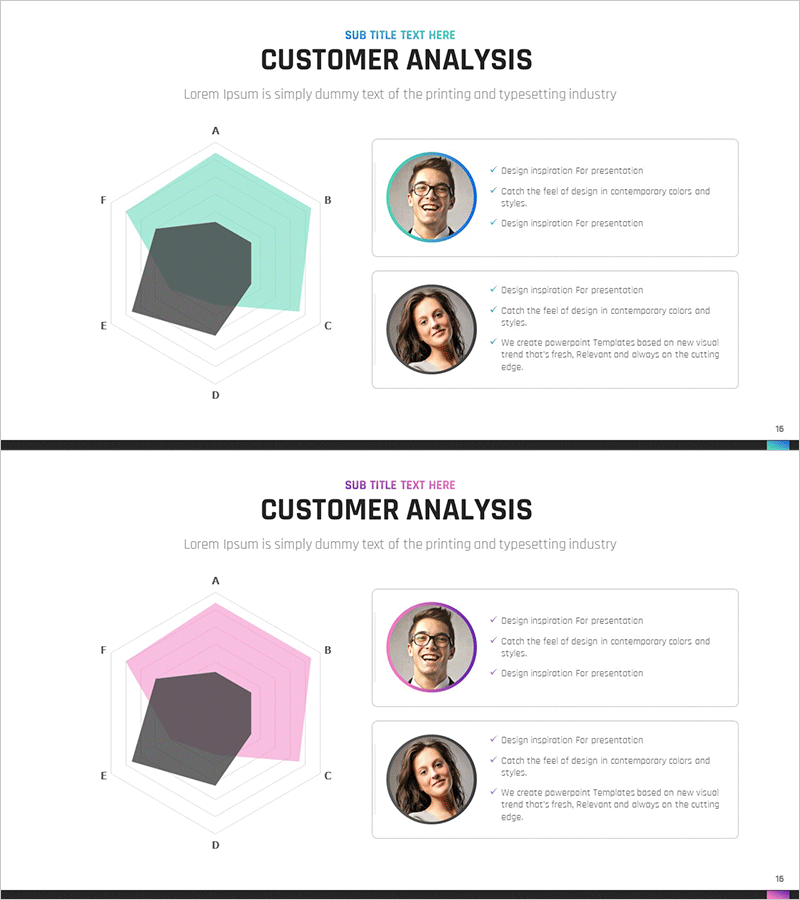
A radial diagram PowerPoint slide featuring five directional branches extending from a central hub, ideal for visualizing customer feedback, user ratings, and market insights. This presentation template uses a dark gray center node with mint green and pink color variants to create visual hierarchy and information structure. The slide design effectively communicates customer-centric insights and analytical findings in business presentations. Each version includes profile sections with accompanying text boxes for detailed explanations.
Usage Points
-
Main Usage
Visualizes information radiating from a central concept, such as customer feedback, user ratings, or market analysis. The radial structure emphasizes the core topic while displaying related elements in five directions, creating clear hierarchical relationships and comprehensive data visualization.
-
How to Use
Insert this slide into business presentations for customer analysis, market research, or feedback summary sections. Place your main topic in the center node and add supporting details in the five surrounding areas. Choose between mint green or pink color versions to match your presentation theme.
-
Recommended For
Marketing professionals, product managers, customer service teams, and executives preparing analytical reports. Ideal for presentations emphasizing customer-centric strategies, feedback analysis results, and market insights.
-
Slide Structure
Two-slide set with identical radial layouts. Each slide features a central dark gray hexagonal node with five directional branches (A, B, C, D, E, F) extending outward. The outer areas are filled with mint green or pink coloring. Two profile photo sections with accompanying text boxes are positioned on the right side for additional information.
Related Products
-

Event Alibi Diagram – Customer Analysis and Success Stories
#Market and Competitor Analysis #Customer Success Stories #Diagram
-

Customer Analysis Radial Graph – Intuitive Data Visualization
#Business Introduction #Market and Competitor Analysis #Diagram
-

Participant Feedback Review Slide – Capturing Customer Voices
#Market and Competitor Analysis #Customer Success Stories #Diagram
-

Customer Analysis Slide Visualizing Trial Results
#Market and Competitor Analysis #Customer Success Stories #Diagram
