Price Quality Positioning Map – Market and Competitor Analysis
RM0100018_25
- Last Update 01/30/2025
- File Size 1MB
- # of Slides 2
- File Format PPTX
- Slide Ratio 16:9
- Color
Keywords
- #Content-Based Slides
- #Design-Based Slides
- #Market and Competitor Analysis
- #Marketing Plan and Strategy
- #Diagram
- #Graph
- #Other
- #Market Analysis
- #Positioning
- #Cluster
- #Closed Cluster Diagram
- #16:9
- #positioning map PowerPoint
- #price quality analysis slide
- #competitor analysis diagram
- #market positioning template
- #four-quadrant matrix PPT
About the Product
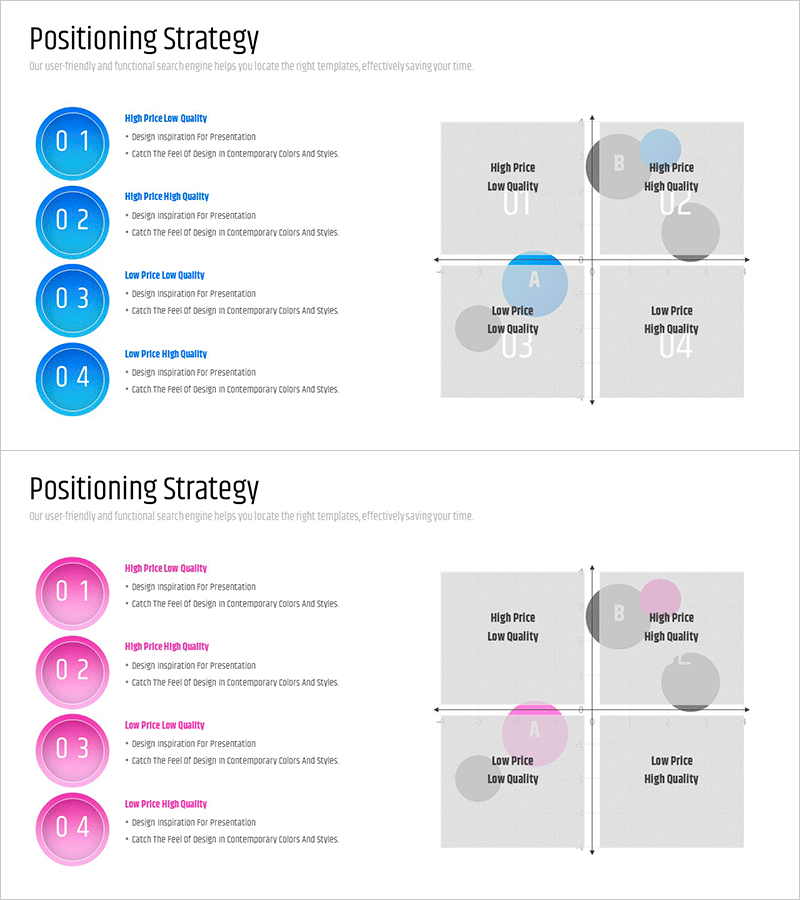
A 2×2 positioning map PowerPoint slide with price and quality as axes for competitive analysis. This slide deck visualizes your company's and competitors' market positions at a glance, ideal for marketing strategy presentations and competitive landscape analysis. The design uses blue and gray circular nodes to represent four positioning quadrants, with a clear central cross-axis for distinction. The left side includes four numbered positioning strategies with text areas for detailed explanations of each approach. Provided in fully editable PPTX format, allowing you to input actual market data and transform it into a professional competitive analysis presentation.
Usage Points
-
Main Usage
Visualizes your company's and competitors' relative market positions using price and quality dimensions to develop competitive strategies. Effectively communicates positioning analysis results in marketing plans, business reports, and strategic planning meetings.
-
How to Use
Enter positioning strategy descriptions (high price-high quality, high price-low quality, low price-low quality, low price-high quality) in the numbered text areas on the left. Place your company and competitors as circular nodes on the right map to show current market positions, then use arrows or additional nodes to indicate target positioning.
-
Recommended For
Marketing managers, strategic planning teams, executives preparing business reports, new business development specialists, and consulting analysts who need to present market positioning strategies and support decision-making.
-
Slide Structure
Two-slide set with each slide featuring four numbered circular nodes (blue and pink tones) on the left and a 2×2 quadrant map on the right. A central cross-axis divides price (horizontal) and quality (vertical) dimensions, with gray circular nodes and accent nodes positioned in each quadrant to represent positioning locations.
Related Products
-

Positioning Map – Market Analysis and Strategy
#Market and Competitor Analysis #Marketing Plan and Strategy #Diagram
-

Space Industry Positioning Diagram – Market Analysis and Strategy
#Market and Competitor Analysis #Marketing Plan and Strategy #Diagram
-

Positioning Area Graph – Essential Slide for Market Analysis
#Market and Competitor Analysis #Marketing Plan and Strategy #Diagram
-

Artificial Intelligence Development Market Positioning Map – Effective Visual Data Comparison
#Market and Competitor Analysis #Marketing Plan and Strategy #Diagram
