Positioning Point Area Graph – Strategy for Market Analysis
RM0100011_25
- Last Update 01/28/2025
- File Size 1MB
- # of Slides 2
- File Format PPTX
- Slide Ratio 16:9
- Color
Keywords
- #Content-Based Slides
- #Design-Based Slides
- #Market and Competitor Analysis
- #Marketing Plan and Strategy
- #Diagram
- #Graph
- #Other
- #Market Analysis
- #Positioning
- #Table
- #16:9
- #positioning matrix PowerPoint
- #2-axis analysis slide
- #market analysis diagram
- #competitive positioning PPT
- #how to create a positioning matrix in PowerPoint
About the Product
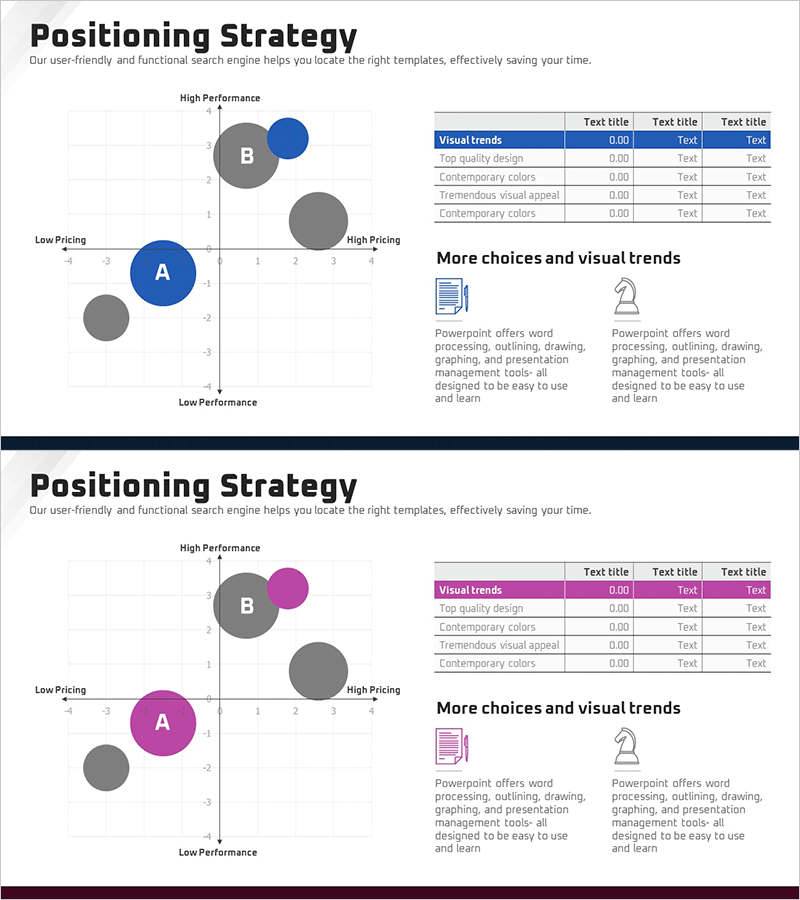
A positioning matrix PowerPoint slide for market analysis and competitive strategy development. This slide features a 4-quadrant layout with two axes—performance (High/Low) and price (Low/High)—to visualize competitor positioning and your company's market position. Bubble charts in each quadrant represent market share and performance metrics. Available in three color versions: blue, gray, and magenta. Ideal for marketing strategy presentations, business planning meetings, and investor pitch decks to effectively communicate market positioning and competitive advantage.
Usage Points
-
Main Usage
Analyze your company's relative market position against competitors using two key dimensions: performance and price. The 4-quadrant structure clearly segments market opportunities from high-performance-low-cost to low-performance-high-cost, enabling strategic decision-making and competitive differentiation.
-
How to Use
Place competitor bubbles in each quadrant, with bubble size representing market share. Highlight your company's position using accent colors. Use the accompanying data table and icons on the right to explain market trends and strategic options. Incorporate into marketing strategy presentations or executive briefings.
-
Recommended For
Marketing managers, strategy planners, business development teams, and investor relations professionals presenting market positioning and competitive strategy. Particularly effective for B2B companies explaining competitive advantages in business strategy presentations and investor pitch decks.
-
Slide Structure
Two-slide set featuring a 4-quadrant positioning matrix with three competitor bubbles and company position marker on the first slide. Second slide includes a 5-row by 4-column data table on the right showing visual trends and two supporting icons. Four main text input areas: title, axis labels, legend, and descriptive text.
Related Products
-

Market Distribution Analysis Positioning Map – Strengthening Competitiveness
#Market and Competitor Analysis #Marketing Plan and Strategy #Diagram
-

Artificial Intelligence Development Market Positioning Map – Effective Visual Data Comparison
#Market and Competitor Analysis #Marketing Plan and Strategy #Diagram
-

Competitor Positioning Graph – Diagram for Market Analysis
#Market and Competitor Analysis #Marketing Plan and Strategy #Diagram
-

Clothing Market Positioning Map – Strategic Analysis
#Market and Competitor Analysis #Marketing Plan and Strategy #Diagram
