Positioning Area Graph – Essential Slide for Market Analysis
RM0100016_25
- Last Update 01/30/2025
- File Size 0.3MB
- # of Slides 2
- File Format PPTX
- Slide Ratio 16:9
- Color
Keywords
- #Content-Based Slides
- #Design-Based Slides
- #Market and Competitor Analysis
- #Marketing Plan and Strategy
- #Diagram
- #Graph
- #Other
- #Market Analysis
- #Positioning
- #Cluster
- #Closed Cluster Diagram
- #16:9
- #positioning matrix PowerPoint slide
- #market analysis diagram
- #2-axis positioning chart
- #competitive analysis slide
- #positioning strategy presentation
- #scatter plot template
About the Product
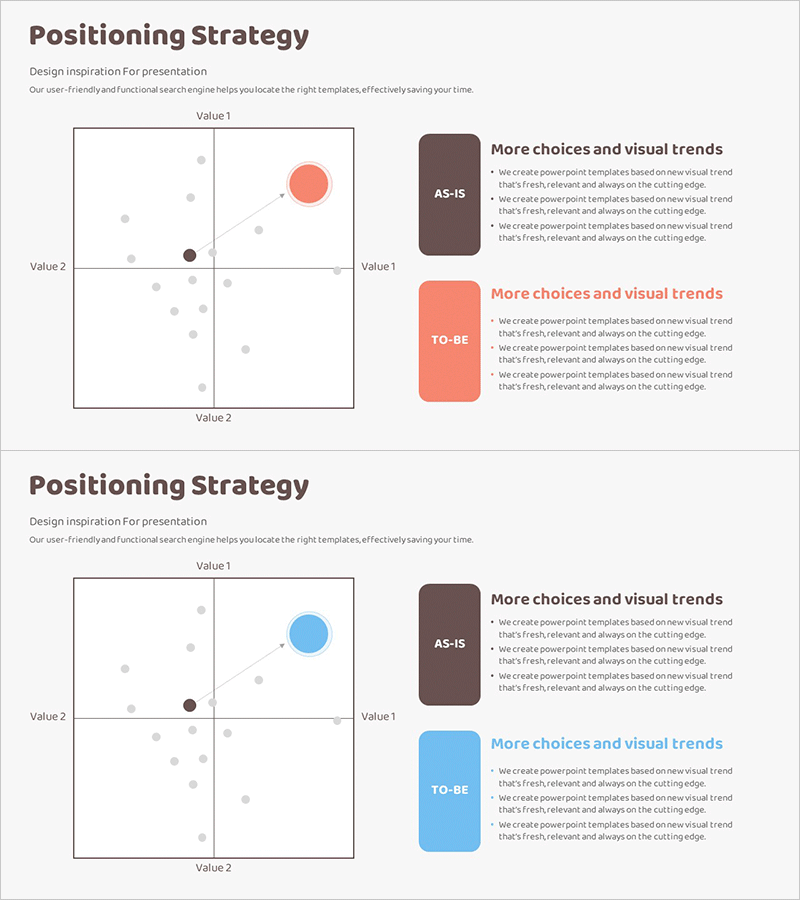
A two-axis positioning matrix PowerPoint slide for competitive analysis and market positioning. The diagram features a scatter plot layout with Value 1 (horizontal) and Value 2 (vertical) axes, allowing you to plot multiple data points representing competitors, products, or market segments. The right side highlights AS-IS (current state) and TO-BE (target state) zones in distinct colors. Gray background with multiple circular nodes enables simultaneous comparison of market positions. Available in 16:9 PPTX format, fully editable and ready for strategic presentations, market analysis reports, and business planning documents.
Usage Points
-
Main Usage
Analyze and visualize competitive positions, product positioning, and customer segmentation using two key variables. Simultaneously display current state (AS-IS) and target state (TO-BE) to communicate strategic direction and market opportunities clearly.
-
How to Use
Define your two analysis dimensions (price vs. quality, features vs. affordability, etc.) and assign them to the horizontal and vertical axes. Plot competitors or products as circular nodes on the matrix. Use the AS-IS and TO-BE boxes on the right to highlight current positioning and strategic goals. Customize colors and node sizes to represent additional data dimensions.
-
Recommended For
Marketing managers, strategy teams, and executives preparing business presentations. Ideal for business plans, marketing strategies, investor pitch decks, competitive analysis reports, and strategic planning sessions where market positioning and competitive landscape need clear visualization.
-
Slide Structure
Two-axis matrix (Value 1 horizontal, Value 2 vertical) with four quadrants, scatter plot area containing multiple gray circular data points plus two highlighted nodes, and right-side zones for AS-IS (dark brown box) and TO-BE (coral box) positioning. 16:9 aspect ratio, 2-slide set.
Related Products
-

Price Quality Positioning Map – Market and Competitor Analysis
#Market and Competitor Analysis #Marketing Plan and Strategy #Diagram
-

Space Industry Positioning Diagram – Market Analysis and Strategy
#Market and Competitor Analysis #Marketing Plan and Strategy #Diagram
-

Positioning Map – Market Analysis and Strategy
#Market and Competitor Analysis #Marketing Plan and Strategy #Diagram
-

STP Strategy Positioning Map – Market Analysis and Marketing Plan
#Market and Competitor Analysis #Marketing Plan and Strategy #Graph
