Space Industry Positioning Diagram – Market Analysis and Strategy
RJ0700002_26
- Last Update 07/21/2025
- File Size 0.4MB
- # of Slides 2
- File Format PPTX
- Slide Ratio 16:9
- Color
Keywords
- #Content-Based Slides
- #Design-Based Slides
- #Market and Competitor Analysis
- #Marketing Plan and Strategy
- #Diagram
- #Graph
- #Other
- #Market Analysis
- #Positioning
- #Cluster
- #Closed Cluster Diagram
- #16:9
- #positioning diagram PowerPoint
- #market analysis slide template
- #4-node bubble chart
- #marketing strategy diagram
- #competitive positioning PPT
About the Product
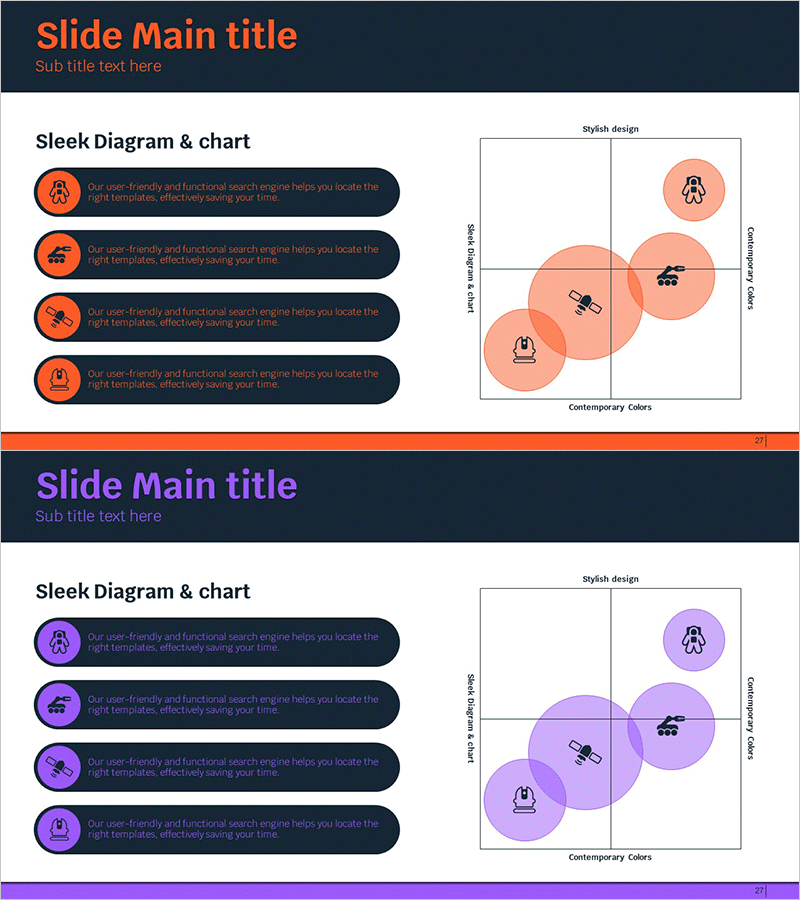
A 2-slide positioning diagram PowerPoint template for space industry market analysis. Four circular nodes arranged in a 2×2 matrix structure visualize competitive positioning, market segmentation, and strategic positioning. The layout combines four text boxes on the left with a bubble chart format on the right, rendered in orange and purple dual-tone colors. Available in 16:9 widescreen PPTX format for immediate editing. Ideal for marketing strategy presentations, market analysis reports, and executive briefing materials.
Usage Points
-
Main Usage
Visualize competitive positioning and company market position in emerging industries like space tech using a 2×2 matrix format. The bubble chart simultaneously represents market size and growth potential for clear market analysis communication.
-
How to Use
Enter competitor names, product names, and strategies in the four left-side text boxes. Adjust bubble size and position on the right chart to represent positioning. Customize colors to match corporate branding.
-
Recommended For
Marketing managers, strategy planning teams, new business development teams, and executives preparing reports. Suitable for business plans, marketing proposals, investor pitch decks, and market analysis reports.
-
Slide Structure
2-slide set. Slide 1: Orange-toned 4-node closed diagram (left: 4 text input boxes + right: 2×2 matrix bubble chart). Slide 2: Purple-toned identical structure. Each node includes icon and text input area.
Related Products
-

Positioning Area Graph – Essential Slide for Market Analysis
#Market and Competitor Analysis #Marketing Plan and Strategy #Diagram
-

Positioning Map – Market Analysis and Strategy
#Market and Competitor Analysis #Marketing Plan and Strategy #Diagram
-

Price Quality Positioning Map – Market and Competitor Analysis
#Market and Competitor Analysis #Marketing Plan and Strategy #Diagram
-

Ratio Infographic Analysis Chart – Optimized for Market Analysis
#Market and Competitor Analysis #Diagram #Graph
