Positioning Map – Market Analysis and Strategy
RM0100017_25
- Last Update 01/30/2025
- File Size 1.6MB
- # of Slides 2
- File Format PPTX
- Slide Ratio 16:9
- Color
Keywords
- #Content-Based Slides
- #Design-Based Slides
- #Market and Competitor Analysis
- #Marketing Plan and Strategy
- #Diagram
- #Graph
- #Other
- #Market Analysis
- #Positioning
- #Cluster
- #Closed Cluster Diagram
- #16:9
- #positioning map PowerPoint
- #market analysis diagram
- #4-quadrant matrix slide
- #competitive analysis PowerPoint
- #marketing strategy template
About the Product
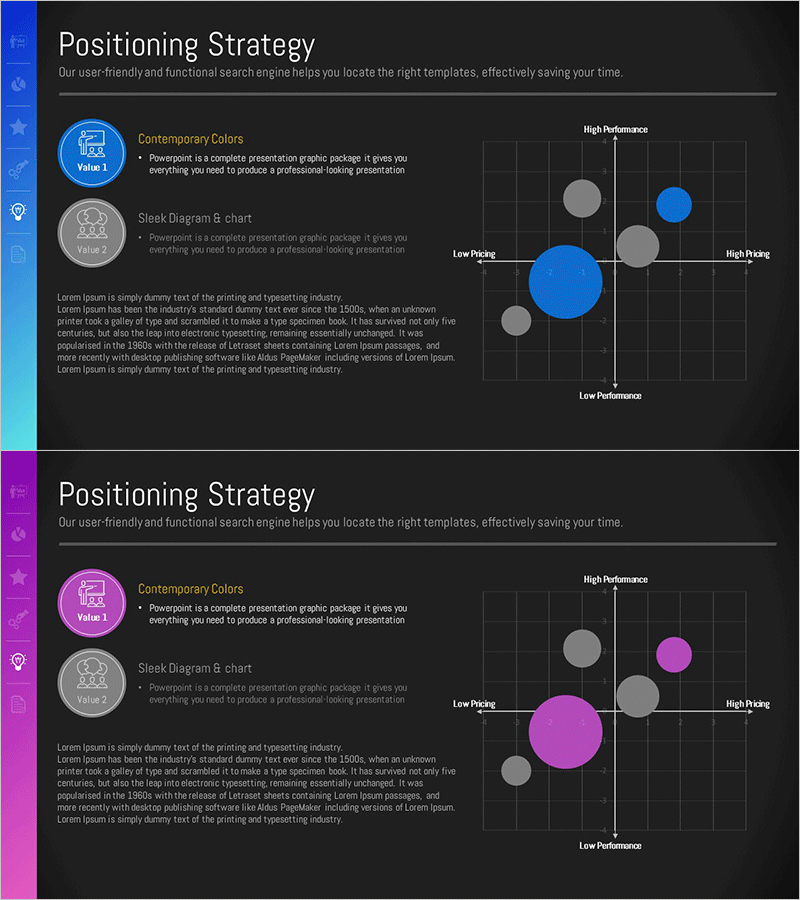
A 2×2 matrix positioning map PowerPoint slide for strategic market analysis. The diagram features a horizontal axis (low price to high price) and vertical axis (low performance to high performance) divided into four quadrants where products and competitors are plotted. Three color versions—blue, gray, and magenta—are included, each with circular nodes and text labels. This presentation slide is ready to use for marketing strategy development, competitive analysis, and product positioning presentations.
Usage Points
-
Main Usage
Visualize a product or brand's market position using two analytical axes such as price-performance, quality-cost, or innovation-stability. This strategic tool is essential in marketing plans, business proposals, and investor pitch decks to clearly communicate competitive positioning.
-
How to Use
Customize the horizontal and vertical axis labels to match your analysis criteria. Enter product names or competitor names in the circular nodes. Add descriptive text for each quadrant to help the audience understand the positioning strategy and market dynamics.
-
Recommended For
Marketing managers, strategy planners, business development teams, management consultants, and MBA students presenting competitive analysis and market positioning. Ideal for product launches, market entry strategies, and brand repositioning initiatives.
-
Slide Structure
Two-slide set. First slide features a blue background with a 4-quadrant matrix (horizontal axis: low to high price, vertical axis: low to high performance) containing five circular nodes. Second slide presents the same structure with a magenta background for color variation. Both slides include axis labels, quadrant description areas, and editable node label fields.
Related Products
-

Positioning Area Graph – Essential Slide for Market Analysis
#Market and Competitor Analysis #Marketing Plan and Strategy #Diagram
-

Space Industry Positioning Diagram – Market Analysis and Strategy
#Market and Competitor Analysis #Marketing Plan and Strategy #Diagram
-

Price Quality Positioning Map – Market and Competitor Analysis
#Market and Competitor Analysis #Marketing Plan and Strategy #Diagram
-

Market Environment Analysis with Line Graph and Positioning Map
#Market and Competitor Analysis #Marketing Plan and Strategy #Graph
