Positioning Analysis Graph – Visualizing Market and Competition
RM0100013_25
- Last Update 01/29/2025
- File Size 0.3MB
- # of Slides 2
- File Format PPTX
- Slide Ratio 16:9
- Color
Keywords
- #Content-Based Slides
- #Design-Based Slides
- #Market and Competitor Analysis
- #Marketing Plan and Strategy
- #Graph
- #Other
- #Market Analysis
- #Positioning
- #16:9
- #positioning analysis PPT slide
- #4-quadrant analysis PowerPoint
- #market competition chart
- #positioning bubble chart PPT
- #marketing strategy analysis slide
About the Product
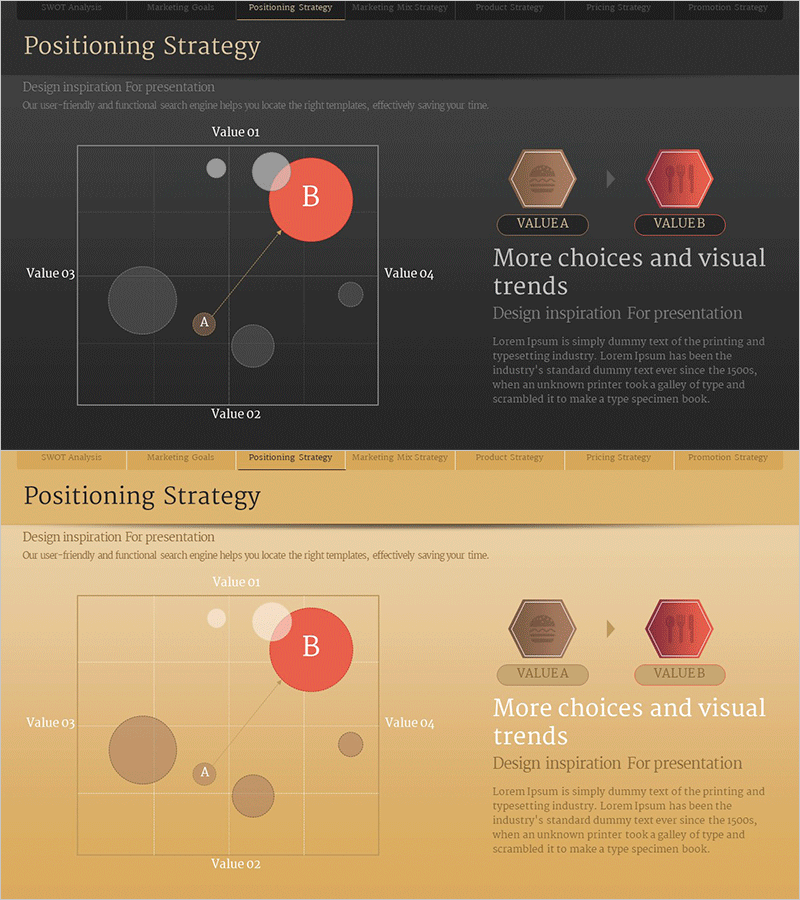
A PowerPoint slide that visualizes market positioning and competitive analysis using a 4-quadrant bubble chart. The 2-slide set offers two color themes—dark gray and beige—with each slide representing competitive positions across four value axes (Value 01–04). Bubble size and position simultaneously express market share and competitive strength, making it ideal for marketing strategy presentations and investor pitches. Optimized for 16:9 widescreen format with clearly separated text and chart areas for immediate use.
Usage Points
-
Main Usage
Visualizes your company's market positioning and competitor locations across a 2-dimensional space defined by four value axes (Value 01–04). Bubble size represents market share while position indicates competitive strength, supporting strategic decision-making.
-
How to Use
Use during market strategy development to analyze your company's relative position versus competitors. Present in investor pitches, executive briefings, and market analysis meetings to provide a clear competitive landscape overview.
-
Recommended For
Marketing managers, strategy planning teams, business development professionals, and investor relations specialists preparing market analysis materials. Suitable for new business entry, product repositioning reviews, and competitive analysis reports.
-
Slide Structure
Each slide features a 4-quadrant bubble chart on the left (with Value 01–04 axes) and a text/description area on the right. Clear section navigation with title at top and tab menu at bottom; bubble positions and sizes are fully customizable.
Related Products
-

Competitor Positioning Graph – Diagram for Market Analysis
#Market and Competitor Analysis #Marketing Plan and Strategy #Diagram
-

Market Distribution Analysis Positioning Map – Strengthening Competitiveness
#Market and Competitor Analysis #Marketing Plan and Strategy #Diagram
-

Positioning Diagram – Market Analysis and Strategy
#Market and Competitor Analysis #Marketing Plan and Strategy #Graph
-

Positioning Market Analysis Chart – Understanding Markets and Strategies
#Market and Competitor Analysis #Marketing Plan and Strategy #Diagram
