Clothing Market Positioning Map – Strategic Analysis
RM0100015_25
- Last Update 01/29/2025
- File Size 3.6MB
- # of Slides 2
- File Format PPTX
- Slide Ratio 16:9
- Color
Keywords
- #Content-Based Slides
- #Design-Based Slides
- #Market and Competitor Analysis
- #Marketing Plan and Strategy
- #Diagram
- #Graph
- #Other
- #Market Analysis
- #Positioning
- #Table
- #16:9
- #positioning map PowerPoint slide
- #market analysis chart template
- #competitive analysis PPT
- #how to create a positioning map in PowerPoint
- #2-quadrant market analysis slide
About the Product
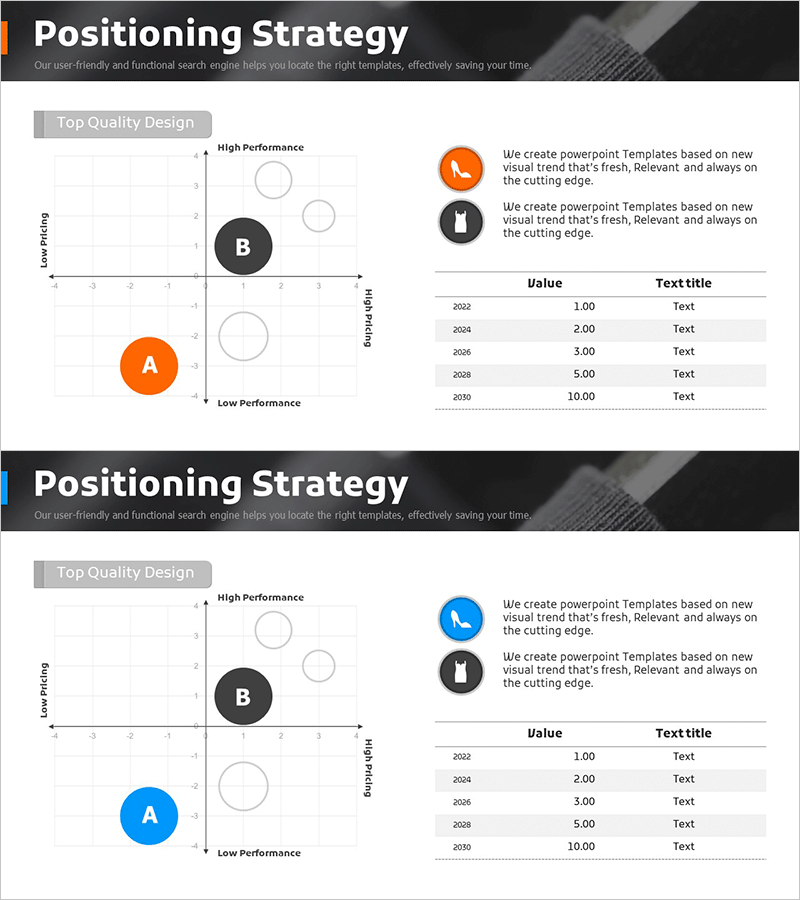
A positioning map PowerPoint slide designed for clothing market analysis and competitive positioning. This 2-slide deck features a 2-quadrant chart layout with axes for high/low performance and high/low pricing, allowing you to visualize competitor positions using orange and black circular markers. The right side includes a legend and data table for detailed competitive insights. The 16:9 widescreen PPTX format enables immediate editing with clearly defined text and numeric input areas, reducing presentation preparation time. Ideal for marketing strategy presentations, business planning, and investor pitches where market positioning analysis is critical.
Usage Points
-
Main Usage
Analyzes the relative market position of competitors across two dimensions (performance, price, etc.) to develop positioning strategy. Serves as a core slide in marketing strategy presentations, business planning documents, and investor pitch decks, providing executives and investors with an intuitive view of competitive dynamics within the market.
-
How to Use
Enter competitor names in the left 2-quadrant chart and adjust circular marker positions to show each competitor's positioning. Fill in the right-side legend with competitor characteristics and add specific metrics (market share, price range, etc.) to the data table. Customize axis labels to match your industry for flexible market analysis applications.
-
Recommended For
Marketing managers, strategic planning teams, and executives presenting market analysis findings. Particularly valuable for new product launch planning, market entry strategy development, and competitive benchmarking analysis. Commonly used in consulting firm strategy proposals and venture capital investment pitch materials.
-
Slide Structure
The slide layout divides into a left 2-quadrant chart area (5 text inputs + 3 circular markers) and a right information section (2 legend entries + 5-row data table). Top title area and axis label input spaces clarify analysis criteria. The 2-slide format accommodates multiple positioning analysis scenarios.
Related Products
-

Market Distribution Analysis Positioning Map – Strengthening Competitiveness
#Market and Competitor Analysis #Marketing Plan and Strategy #Diagram
-

Positioning Analysis Chart – Market Competitiveness Strategy
#Market and Competitor Analysis #Marketing Plan and Strategy #Diagram
-

Positioning Market Analysis Chart – Understanding Markets and Strategies
#Market and Competitor Analysis #Marketing Plan and Strategy #Diagram
-

Positioning Point Area Graph – Strategy for Market Analysis
#Market and Competitor Analysis #Marketing Plan and Strategy #Diagram
