Market Share Donut Pie Chart
RM0100008_11
- Last Update 01/26/2025
- File Size 0.4MB
- # of Slides 2
- File Format PPTX
- Slide Ratio 16:9
- Color
Keywords
- #Content-Based Slides
- #Design-Based Slides
- #Product/Service Introduction
- #Market and Competitor Analysis
- #Diagram
- #Graph
- #Development Status
- #Market Share
- #Cluster
- #Circles
- #Closed Cluster Diagram
- #Doughnut Chart
- #16:9
- #donut pie chart PowerPoint
- #market share slide template
- #pie chart presentation
- #ratio comparison chart PPT
- #market analysis PowerPoint slide download
About the Product
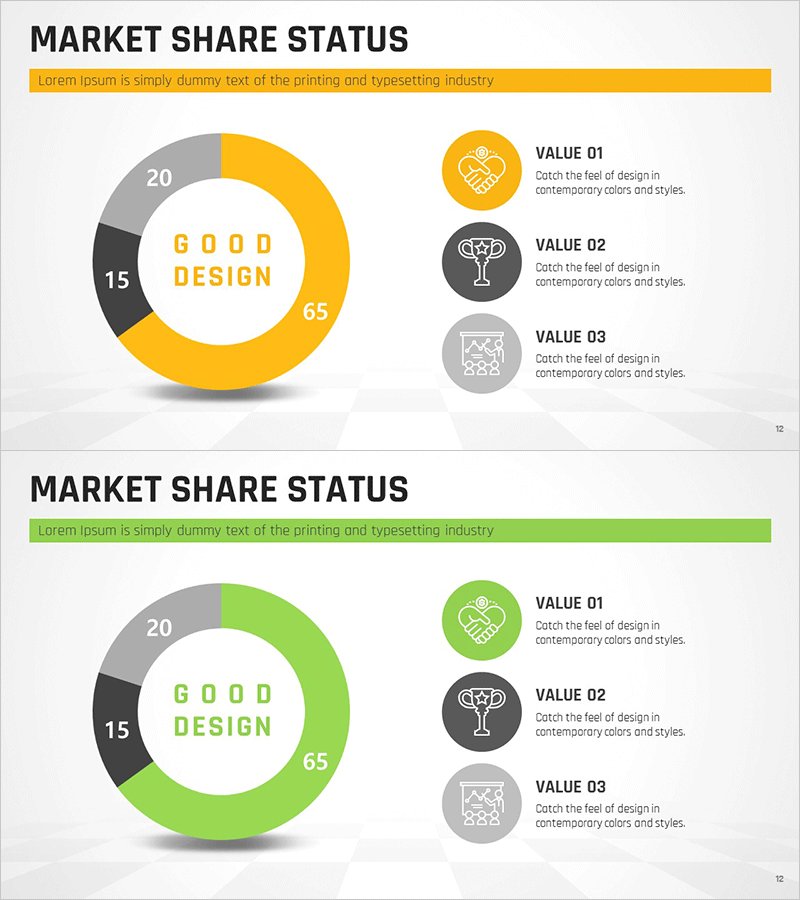
A professional donut pie chart PowerPoint slide designed to visualize market share distribution at a glance. The template features a 3-segment donut chart in yellow, gray, and dark gray color scheme, paired with an icon-based value explanation layout on the right side. Two slides provide both yellow and green color variants of the same structure, allowing you to match your presentation theme and brand colors. Ideal for business reports, marketing presentations, investor pitch decks, and competitive positioning analyses where clear market position communication is essential.
Usage Points
-
Main Usage
Visualize three or more categorical data points—such as market share, competitor comparison, or customer segmentation—using a circular donut chart format. The center text area labeled 'GOOD DESIGN' can be customized as your key message to create emphasis and draw audience focus to the core insight.
-
How to Use
Apply this slide to the market analysis section of marketing plans, performance overview pages in business reports, competitive positioning slides in investor presentations, and customer segmentation analyses. Simply edit the VALUE 01, 02, and 03 labels and descriptions to match each segment's meaning, and the slide is ready to present.
-
Recommended For
Marketing teams presenting market analysis, executives delivering quarterly business reviews, investor relations professionals preparing pitch decks, product managers analyzing customer segments, and sales teams comparing competitive positioning. Suitable for C-level presentations and stakeholder communications.
-
Slide Structure
Two-slide set: Slide 1 features a yellow-toned donut pie chart with 65% primary segment, 20% secondary segment, and 15% tertiary segment. Slide 2 provides an identical structure in green color variant. Each slide includes a right-aligned three-icon value explanation area. 16:9 widescreen format, fully editable PPTX elements.
Related Products
-

Market Share Characteristics Analysis Graph – Data-Driven Insights
#Product/Service Introduction #Market and Competitor Analysis #Diagram
-

Mobile App Market Share Analysis Graph
#Product/Service Introduction #Market and Competitor Analysis #Diagram
-

Baby Products Business Market Share – Visualized with Trendy Design
#Product/Service Introduction #Market and Competitor Analysis #Diagram
-

Market Share Analysis by Sector Pie Chart
#Product/Service Introduction #Market and Competitor Analysis #Diagram
