Donut Chart Slide for Market Share Status – Asset Management Development
RM0100017_11
- Last Update 01/30/2025
- File Size 0.3MB
- # of Slides 2
- File Format PPTX
- Slide Ratio 16:9
- Color
Keywords
- #Content-Based Slides
- #Design-Based Slides
- #Product/Service Introduction
- #Market and Competitor Analysis
- #Diagram
- #Graph
- #Development Status
- #Market Share
- #Cluster
- #Circles
- #Closed Cluster Diagram
- #Doughnut Chart
- #16:9
- #donut chart PowerPoint slide
- #pie chart data visualization
- #market share presentation template
- #3-segment ratio chart
- #business report graph slide
About the Product
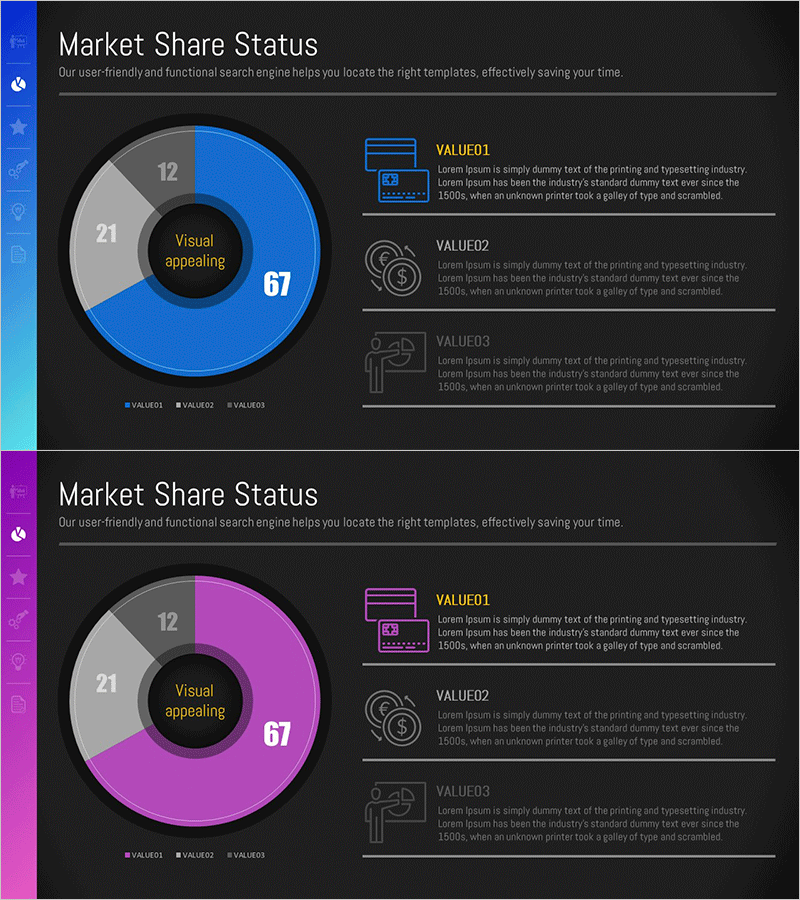
A donut chart PowerPoint slide that displays market share status across three segments with clear visual distinction. The design uses a blue, gray, and black color palette to represent each proportion intuitively. The center features a 'Visual appealing' text area for emphasizing key messages, while the right side includes VALUE01, VALUE02, and VALUE03 icons with corresponding description fields. This 2-slide template is ready to use for asset management presentations, development status reports, and business analytics where data-driven visualization is essential.
Usage Points
-
Main Usage
This donut chart slide effectively communicates proportional relationships such as market share, asset allocation, and development progress. The center text area highlights key messages while the right-side icon section allows detailed explanations for each segment.
-
How to Use
Use this template in investor presentations, business status updates, and asset management briefings to convey quantitative data visually. Edit the chart segments, colors, and numerical values to match your actual data, and customize the description text for each VALUE item.
-
Recommended For
Finance professionals, business development teams, marketing analysts, and executives presenting to stakeholders or investors. Ideal when comparing 3-5 items by proportion and requiring clear visual hierarchy with supporting details.
-
Slide Structure
The donut chart contains 3 segments (blue 67%, gray 21%, black 12%) with a center text area labeled 'Visual appealing'. The right side displays 3 value items (VALUE01, VALUE02, VALUE03) with icons and editable description text arranged vertically. Includes 2 slide layouts.
Related Products
-

Market Share Donut Pie Chart
#Product/Service Introduction #Market and Competitor Analysis #Diagram
-

Market Share Analysis by Sector Pie Chart
#Product/Service Introduction #Market and Competitor Analysis #Diagram
-

Baby Products Business Market Share – Visualized with Trendy Design
#Product/Service Introduction #Market and Competitor Analysis #Diagram
-

Mobile App Market Share Analysis Graph
#Product/Service Introduction #Market and Competitor Analysis #Diagram
