Financial KPI Drivers Slide – 3-Metric Dark Red & Purple
RBTK0200001_7
- Last Update 05/06/2026
- File Size 12.7MB
- # of Slides 2
- File Format PPTX
- Slide Ratio 16:9
- Color
Keywords
- #Business Strategy
- #Financial Plans and Performance
- #Diagram
- #Achievements
- #Key Financial Indicators
- #Flow
- #Converging Flow Diverging Flow
- #16:9
- #financial breakdown KPI drivers PowerPoint slide
- #financial performance review presentation template
- #KPI annual change slide deck dark theme
- #board presentation financial analysis PowerPoint
- #three-metric financial performance presentation slide
About the Product
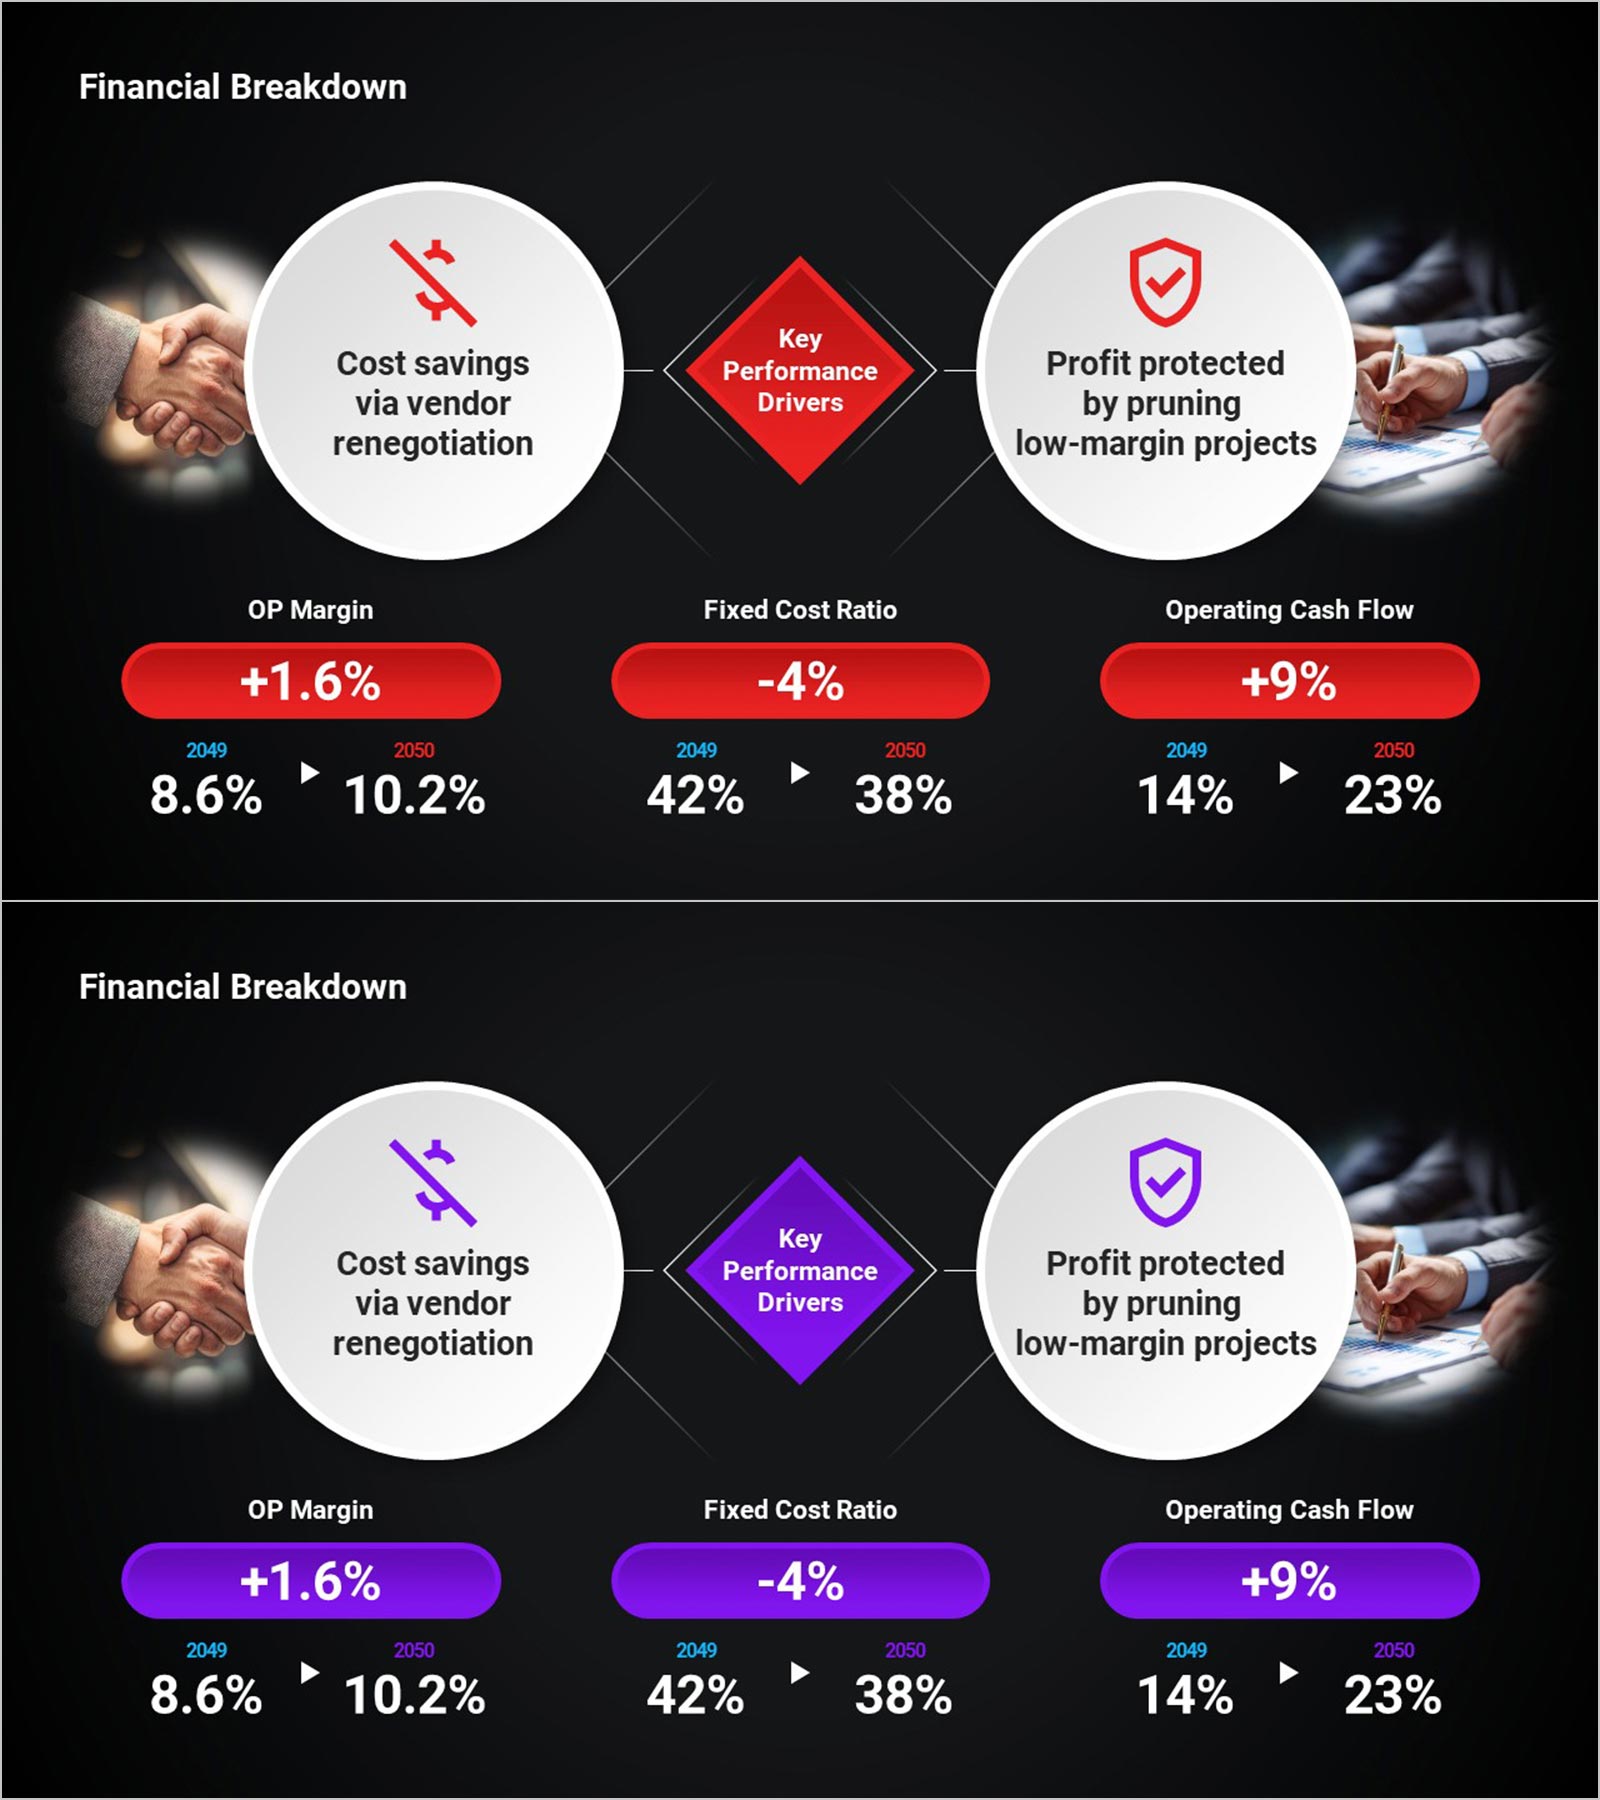
Financial performance breakdown PowerPoint slide with two key driver circles, a connecting diamond, and three KPI metric rows. The upper section presents two circular cards: left (Cost savings via vendor renegotiation, cost icon) and right (Profit protected by pruning low-margin projects, shield icon), connected by a center "Key Performance Drivers" diamond. The lower section displays three annual KPI changes in pill buttons: OP Margin (+1.6%, 8.6% to 10.2%), Fixed Cost Ratio (-4%, 42% to 38%), and Operating Cash Flow (+9%, 14% to 23%), each with year-over-year figures (2049 to 2050). Dark background in red-accent and purple-accent variants. Editable in PowerPoint for corporate board presentations, financial performance reports, and IR pitch decks.
Usage Points
-
Main Usage
Use as the financial performance section in corporate board presentations and IR pitch decks. Presents key cost drivers and three annual KPI changes in one PowerPoint slide.
-
How to Use
Replace driver circle texts and icons with your cost or profit factors. Update the three KPI labels, pill values, and year-over-year figures with your data in PowerPoint.
-
Recommended For
Ideal for corporate CFOs, financial planning teams, and IR managers presenting annual financial performance drivers and KPI improvements to board members and investors.
-
Slide Structure
One slide. Title. Top: two driver circles with icons and center diamond label. Bottom: three KPI pill metrics with year-over-year figures. Dark red and purple versions.
Related Products
-

Changes in Sales and Future Outlook – Supporting Business Strategy
#Business Strategy #Financial Plans and Performance #Diagram
-

Spot Multidirectional Diagram – Visualizing Business Strategies
#Product/Service Introduction #Business Strategy #Diagram
-

Visualizing Financial Performance with Standard Table Slide
#Financial Plans and Performance #Diagram #Balance Sheet
-

Line PPT Table (Green & Orange) – Visualizing Financial Performance Data
#Financial Plans and Performance #Diagram #Sales and Revenue
