Spot Multidirectional Diagram – Visualizing Business Strategies
RJ0600016_6
- Last Update 06/24/2025
- File Size 0.5MB
- # of Slides 2
- File Format PPTX
- Slide Ratio 16:9
- Color
Keywords
- #Content-Based Slides
- #Design-Based Slides
- #Product/Service Introduction
- #Business Strategy
- #Diagram
- #Graph
- #Other
- #Benefits and Advantages
- #Achievements
- #Flow
- #Converging Flow Diverging Flow
- #16:9
- #divergence convergence diagram PowerPoint
- #bidirectional arrow diagram
- #two-way comparison slide
- #decision-making diagram
- #business strategy visualization PowerPoint
About the Product
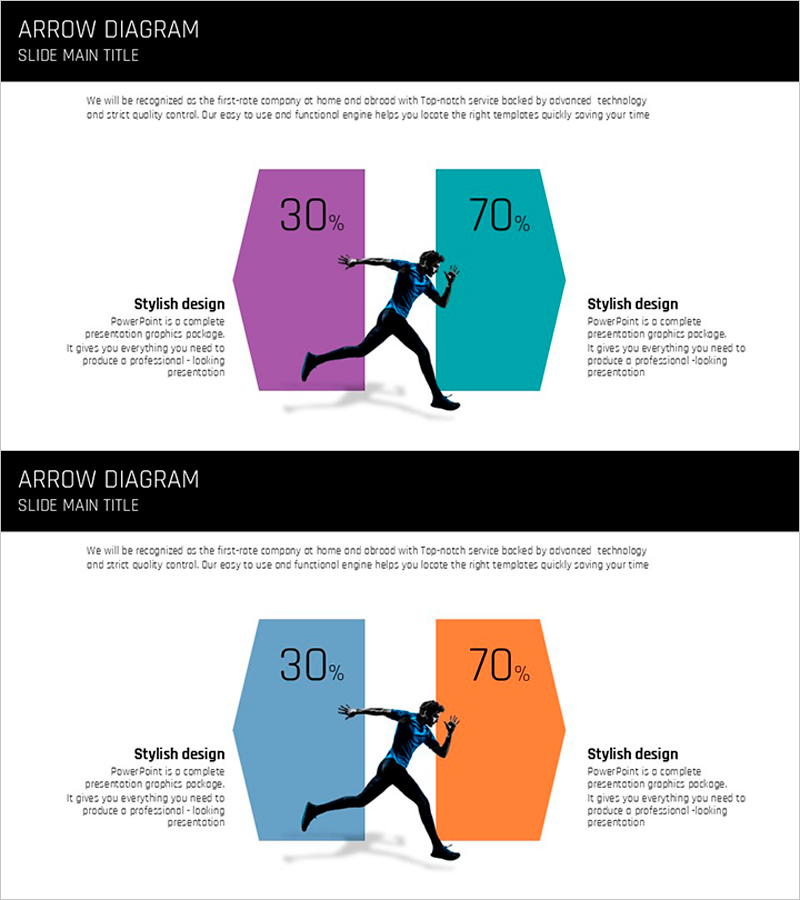
A divergence-convergence diagram PowerPoint slide that visualizes two contrasting choices or strategies using opposing arrows. The design features contrasting color pairs—purple and teal, or blue and orange—to represent each direction's proportion with percentages, while a central action silhouette emphasizes the decision-making moment. Ideal for business strategy presentations, project option comparisons, marketing direction decisions, and scenarios requiring clear distinction between competing alternatives. The 2-slide set provides multiple color combinations with fully editable text and numerical fields for customization.
Usage Points
-
Main Usage
Presents two competing strategies, alternatives, or directional choices simultaneously while clearly comparing their relative importance or allocation. Effectively illustrates decision-making processes by contrasting the pros and cons of Option A versus Option B, or prioritizing competing business, marketing, sales, or operational strategies.
-
How to Use
Replace the center percentage values and left-right text boxes with your own data. Adjust arrow directions and colors to match your strategic context. Choose between the two color combinations (purple-teal or blue-orange) provided across the 2 slides. Use each slide to address one comparison point within your presentation flow.
-
Recommended For
Executive strategy presentations on business direction decisions, marketing teams comparing campaign strategies, project managers presenting resource allocation scenarios, investor pitches (IR) showcasing growth path alternatives, consulting reports presenting comparative recommendations, and organizational change management discussions.
-
Slide Structure
2-slide set. Each slide centers on an action silhouette flanked by two hexagonal shapes (purple/teal or blue/orange) containing percentages and descriptive text. Three-tier layout: title area at top, comparison area in center, and explanation text area at bottom. All text and percentage fields are fully editable.
Related Products
-

Progress Donut Chart for Each Library Service
#Business Strategy #Market and Competitor Analysis #Graph
-

Exercise Ability Improvement Graph
#Business Strategy #Market and Competitor Analysis #Graph
-

Financial Performance and Forecast – Diagram for Business Strategy
#Business Strategy #Financial Plans and Performance #Diagram
-

Three-Dimensional Graph Analysis – Market and Competitor Analysis Slide
#Product/Service Introduction #Market and Competitor Analysis #Marketing Plan and Strategy
