Line PPT Table (Green & Orange) – Visualizing Financial Performance Data
RB0800018_11
- Last Update 03/21/2025
- File Size 0.1MB
- # of Slides 2
- File Format PPTX
- Slide Ratio 4:3
- Color
Keywords
About the Product
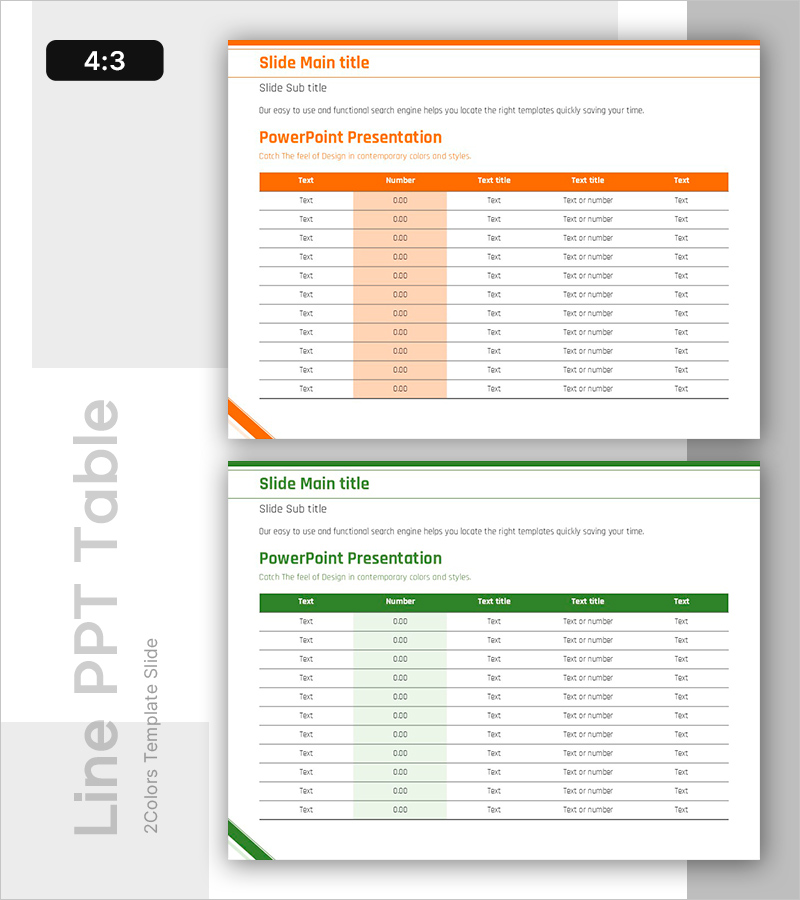
A 10-row horizontal table PowerPoint slide designed to organize financial performance and sales data with clarity. Features orange header and green accent lines in two color variations, with editable cells for item names, numerical values, and descriptions. Provided in 4:3 aspect ratio PPTX format for seamless insertion into existing presentations. Optimized for visualizing quarterly revenue, expenses, profit margins, and other financial metrics. Suitable for all business presentations requiring text-based data comparison and structured information display.
Usage Points
-
Main Usage
Organize and compare numerical data such as financial performance, sales results, and cost analysis in row-by-row format. Each row accommodates item names, values, and descriptions, enabling systematic information delivery to investors, executives, and team members for data-driven decision-making.
-
How to Use
Open the slide and modify header row labels (Item, Value, Description, Notes, etc.) as needed. Enter specific figures and descriptions in each data row. Orange header and green accent lines apply automatically—simply replace text. Duplicate existing rows to expand the table if additional rows are required.
-
Recommended For
Finance teams, executives, marketing teams, and sales teams presenting quarterly performance, budget status, and sales target achievement. Ideal for business plans, performance reports, investor pitch decks, and marketing strategy documents.
-
Slide Structure
2-slide set. Slide 1: Orange header with 10-row data area (5 columns per row: Item, Value, Description, Notes, Additional Info). Slide 2: Green header with identical 10-row structure. 4:3 aspect ratio PPTX format compatible with all PowerPoint versions.
Related Products
-

Effective Data Table Slide – Financial Planning and Performance
#Financial Plans and Performance #Diagram #Sales and Revenue
-

Cost Table by Beans – Unique Financial Analysis
#Financial Plans and Performance #Diagram #Sales and Revenue
-

Logistics Factor Comparison Table – Intuitive Data Analysis
#Financial Plans and Performance #Diagram #Sales and Revenue
-

Colors Theme Presentation Template Table – Financial Planning and Performance
#Financial Plans and Performance #Diagram #Sales and Revenue
