Changes in Sales and Future Outlook – Supporting Business Strategy
RJ0800052_19
- Last Update 08/15/2025
- File Size 0.7MB
- # of Slides 2
- File Format PPTX
- Slide Ratio 16:9
- Color
Keywords
- #Content-Based Slides
- #Design-Based Slides
- #Business Strategy
- #Financial Plans and Performance
- #Diagram
- #Achievements
- #Key Financial Indicators
- #Table
- #Standard Table
- #16:9
- #sales comparison table PowerPoint
- #year-over-year data slide template
- #financial analysis presentation
- #business strategy slide deck
- #data table PPT download
About the Product
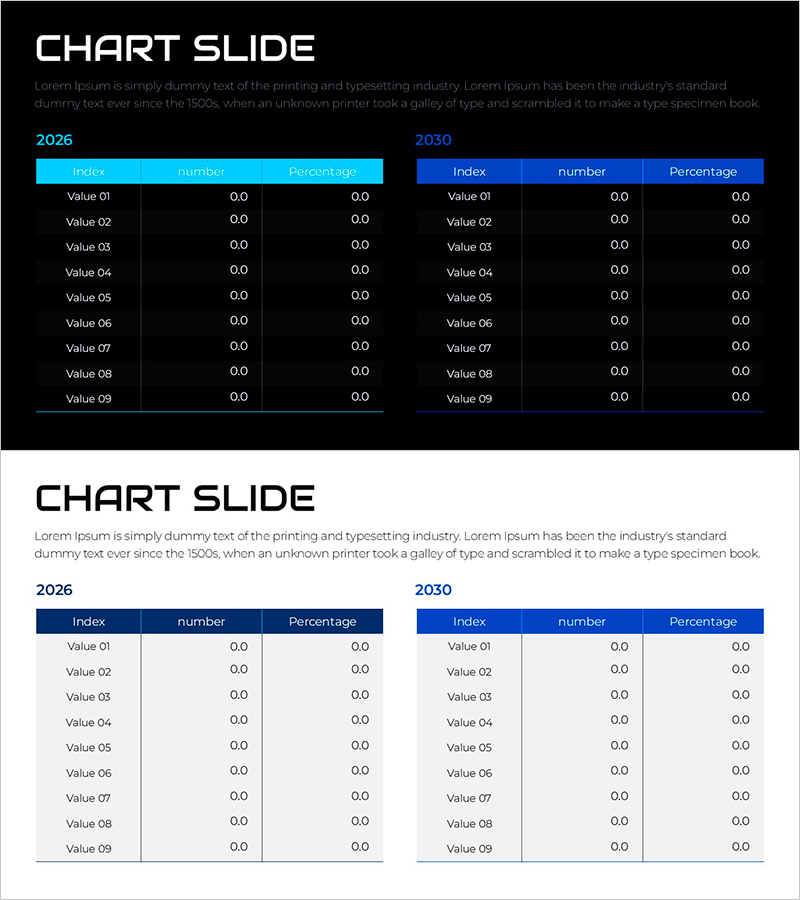
A professional table-based PowerPoint slide comparing sales metrics between 2026 and 2030. The design features a black background with blue headers, presenting two side-by-side data tables with Index, Number, and Percentage columns. White typography ensures high contrast and readability during presentations, making it ideal for financial reports, business strategy decks, and executive briefings. The slide set includes 2 slides in 16:9 aspect ratio, PPTX format, ready for immediate use in corporate presentations.
Usage Points
-
Main Usage
Enables side-by-side comparison of annual sales metrics (Index, Number, Percentage) to clearly visualize business performance trends. The high-contrast black and blue table design supports credible data presentation in executive briefings, investor meetings, and corporate training sessions.
-
How to Use
Insert this slide in the financial planning or business strategy section to present both historical performance and future projections simultaneously. Simply replace the placeholder values (Value 01–09) with actual data, and customize the color scheme to match your corporate branding guidelines.
-
Recommended For
CFOs, financial analysts, business planning teams, and executives presenting quarterly or annual performance reviews. Ideal for consulting firms, financial institutions, and corporate strategy departments requiring comparative analysis visuals in formal presentations.
-
Slide Structure
Two-slide set with dual independent tables per slide (2026 and 2030 data positioned side-by-side). Each table contains 3 columns (Index, Number, Percentage) and 9 data rows (Value 01–09), with blue headers and white text creating clear information hierarchy.
Related Products
-

Business Goal Setting Table – The First Step in Business Strategy Development
#Business Vision and Strategy #Financial Plans and Performance #Diagram
-

Paper Theme Key Financial Indicators Slide
#Financial Plans and Performance #Diagram #Income Statement
-

Key Financial Indicators Table – Effective Data Presentation
#Financial Plans and Performance #Diagram #Income Statement
-

Data Table Slide | Numerical Comparison & Summary Report PPT
#Financial Plans and Performance #Diagram #Projected Return on Investment (ROI)
