Application Development Status Visualized with Doughnut Diagram
RJ0400054_6
- Last Update 06/01/2025
- File Size 0.2MB
- # of Slides 2
- File Format PPTX
- Slide Ratio 16:9
- Color
Keywords
- #Content-Based Slides
- #Design-Based Slides
- #Product/Service Introduction
- #Market and Competitor Analysis
- #Diagram
- #Graph
- #Development Status
- #Market Share
- #Cluster
- #Circles
- #Closed Cluster Diagram
- #Doughnut Chart
- #16:9
- #doughnut chart PowerPoint
- #pie chart slide template
- #4-item progress visualization
- #circular gauge presentation
- #multi-value comparison slide
- #data dashboard PowerPoint
About the Product
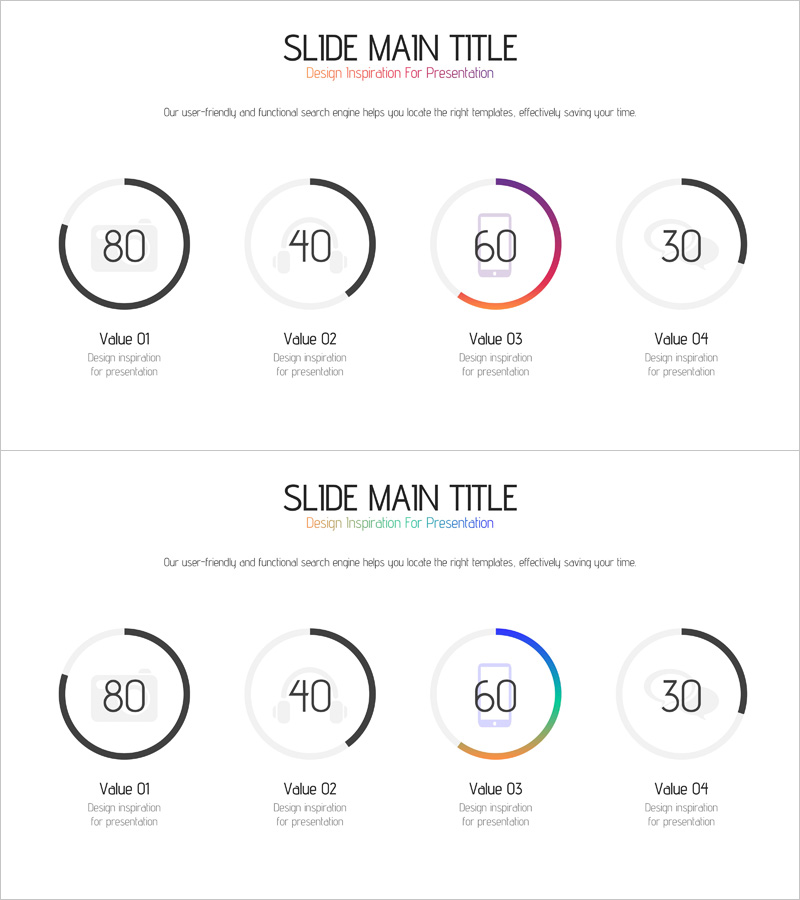
A PowerPoint slide that visualizes the progress status and proportions of four items using doughnut-shaped charts. Each circular gauge displays numerical values (80, 40, 60, 30) in distinct colors—black, gray, purple, orange, and blue—creating an intuitive data representation. The minimal layout combines arc-shaped progress indicators with icon elements, making it ready for immediate use in presentation data sections. Available in 16:9 widescreen format, fully editable PPTX, with 2-slide composition.
Usage Points
-
Main Usage
Optimized for displaying project progress, development status, market share, resource allocation, and other 4-item numerical comparisons. Each doughnut gauge operates independently, allowing simultaneous visualization of multiple metrics and KPIs.
-
How to Use
Insert into business reports, project status presentations, and marketing analysis materials in the data section. Edit the numerical values and labels to match your actual data, and adjust colors to align with your brand guidelines or presentation theme.
-
Recommended For
Project managers, marketing professionals, financial analysts, and sales leaders presenting periodic reports or performance updates. Particularly effective when comparing multiple metrics simultaneously or tracking progress across different departments.
-
Slide Structure
2-slide composition with 4 doughnut charts arranged horizontally on each slide. Title and descriptive text at the top, arc-shaped gauges (0–100 range) in the center, and labels with subtitles at the bottom. First slide features purple and orange tones; second slide uses blue and orange variations for design flexibility.
Related Products
-

Donut Chart Slide for Market Share Status – Asset Management Development
#Product/Service Introduction #Market and Competitor Analysis #Diagram
-

Mobile App Market Share Analysis Graph
#Product/Service Introduction #Market and Competitor Analysis #Diagram
-

Market Share Characteristics Analysis Graph – Data-Driven Insights
#Product/Service Introduction #Market and Competitor Analysis #Diagram
-

Market Share Donut Pie Chart
#Product/Service Introduction #Market and Competitor Analysis #Diagram
