Flow Diagram Visualizing Future Achievement Goals and Strategies
RJ0900034_12
- Last Update 08/30/2025
- File Size 0.3MB
- # of Slides 2
- File Format PPTX
- Slide Ratio 16:9
- Color
Keywords
- #Content-Based Slides
- #Design-Based Slides
- #Business Vision and Strategy
- #Marketing Plan and Strategy
- #Diagram
- #Graph
- #Other
- #Business Goals
- #Marketing Objectives
- #Flow
- #Linear Flow
- #16:9
- #linear flow diagram PowerPoint
- #goal strategy visualization slide
- #6-stage process diagram
- #business plan flowchart PPT
- #how to create flow diagram in PowerPoint
About the Product
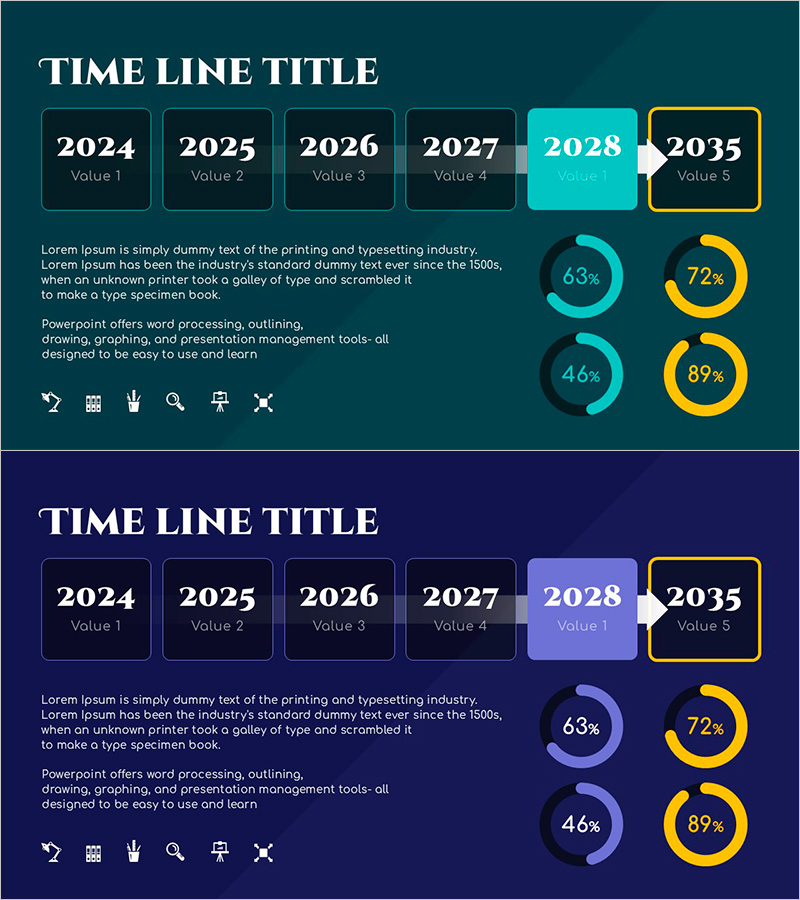
A linear flow diagram PowerPoint slide that visualizes business goals and strategies in sequential stages. The design uses a two-tone color scheme of teal and gold to distinguish between present and future, with six nodes connected by arrows in a left-to-right progression. Each stage includes editable text areas for organizing vision, objectives, strategies, and implementation plans. This 2-slide template is ready to use immediately for various presentation scenarios including strategy meetings, investor pitches, and organizational communications.
Usage Points
-
Main Usage
Designed to clearly visualize corporate strategy from vision to execution plan through sequential stages. The linear flow structure intuitively expresses cause-and-effect relationships and progressive processes, while the teal (present) and gold (future) two-tone color scheme effectively communicates temporal progression and organizational change.
-
How to Use
Enter vision, objectives, strategies, implementation plans, and performance metrics into each node's text area to represent your company's long-term roadmap. Use in executive briefings, strategy sessions, investor presentations, and internal communications. Freely customize colors and text to match your brand identity and presentation context.
-
Recommended For
Ideal for executives, strategic planning teams, marketing managers, and business development professionals presenting medium to long-term plans. Suitable for business plans, strategy reports, investor pitch decks, and organizational vision-sharing presentations. Applicable across all organization sizes from startups to enterprises.
-
Slide Structure
2-slide template featuring 6 nodes connected by arrows in a left-to-right linear progression. First slide has teal background, second slide features dark blue background. Each node includes editable text areas with circular progress indicators (63%, 72%, 46%, 89%) positioned alongside the diagram elements.
Related Products
-

Customer and Service Analysis and Strategy – Data-Driven Approach
#Market and Competitor Analysis #Marketing Plan and Strategy #Diagram
-

Mobile Content Performance Analysis – Data-Driven Business Vision and Marketing Strategy
#Business Vision and Strategy #Marketing Plan and Strategy #Graph
-

Magic Analysis Chart for Visualizing Operations and Marketing Goals
#Operational Plan #Marketing Plan and Strategy #Diagram
-

Cluster Diagram for Setting Business Goals
#Business Vision and Strategy #Marketing Plan and Strategy #Diagram
