Customer and Service Analysis and Strategy – Data-Driven Approach
RJ0600082_19
- Last Update 07/12/2025
- File Size 0.2MB
- # of Slides 2
- File Format PPTX
- Slide Ratio 16:9
- Color
Keywords
- #Content-Based Slides
- #Design-Based Slides
- #Market and Competitor Analysis
- #Marketing Plan and Strategy
- #Diagram
- #Graph
- #Other
- #Customer Analysis
- #Marketing Objectives
- #Flow
- #Linear Flow
- #16:9
- #arrow diagram PowerPoint
- #3-directional flow chart
- #customer analysis slide
- #service strategy presentation
- #data visualization PPT slide
- #business metrics template
About the Product
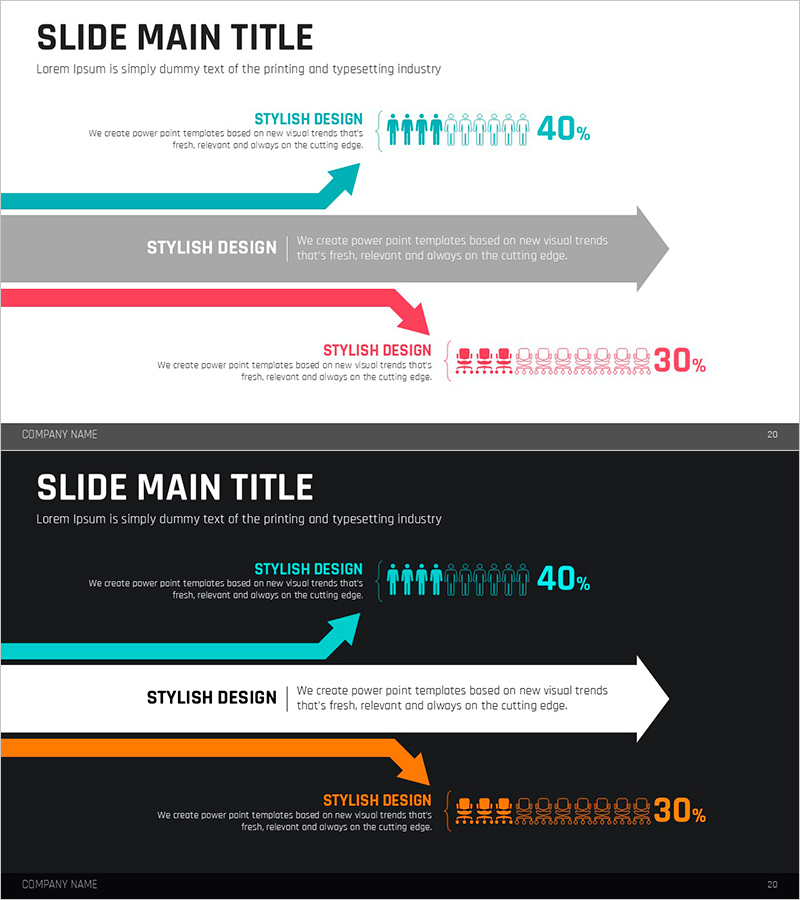
A 3-directional arrow flow diagram PowerPoint slide designed to visualize customer and service analysis with strategic insights. Three colored arrows—teal, gray, and pink—represent upward, stable, and downward trends simultaneously, with icons and percentage data positioned above each arrow to compare performance metrics across customer segments at a glance. Provided in two versions with light and dark backgrounds to adapt to any presentation environment. Text and numerical values are fully editable, making this slide template ideal for marketing analysis, market research, and service strategy presentations that require immediate deployment.
Usage Points
-
Main Usage
Compare and analyze three or more data sets simultaneously—such as customer segment performance metrics, service line growth rates, or marketing channel conversion rates. Each arrow intuitively represents upward, stable, or downward trends, making it highly effective for executive reports, marketing strategy documents, and strategic presentations.
-
How to Use
Replace the text labels and percentage values shown on the slide with your own data. Arrow colors and icons can be customized to match customer groups, service types, or strategic directions. Use the light background version for daytime presentations and the dark background version for evening or high-contrast environments.
-
Recommended For
Marketing managers, business strategy teams, executive report writers, market analysts, and service planning teams presenting customer analysis, performance comparisons, and strategic initiatives. Particularly useful when comparing three or more categories in parallel.
-
Slide Structure
Two-slide set. Slide 1 features a light background with three arrows—teal, gray, and pink—positioned upward, horizontal, and downward respectively. Each arrow displays an icon (people silhouette, document, chart) and percentage data above it. Slide 2 mirrors the structure with a dark background and white text for enhanced readability.
Related Products
-

Flow Diagram Visualizing Future Achievement Goals and Strategies
#Business Vision and Strategy #Marketing Plan and Strategy #Diagram
-

Customer Analysis Infographic Chart – Visualizing Competitive Edge
#Market and Competitor Analysis #Graph #Other
-

Visualizing Marketing Goals and Prospects – Opportunities for Success
#Business Strategy #Marketing Plan and Strategy #Graph
-

Soccer Game Illustration Graph for Market and Competitive Analysis
#Business Strategy #Market and Competitor Analysis #Graph
