Silhouette Diagram Slide – Stylish Designs for Creative Professionals
RJ0400043_7
- Last Update 05/28/2025
- File Size 0.1MB
- # of Slides 2
- File Format PPTX
- Slide Ratio 16:9
- Color
Keywords
- #Content-Based Slides
- #Design-Based Slides
- #Business Vision and Strategy
- #Business Strategy
- #Diagram
- #Other
- #Business Goals
- #Step-by-Step Schedule Plan
- #Flow
- #Linear Flow
- #Silhouette
- #16:9
- #silhouette diagram PowerPoint slide
- #human silhouette process flow
- #3-step diagram template
- #circular node diagram
- #business process visualization PowerPoint
About the Product
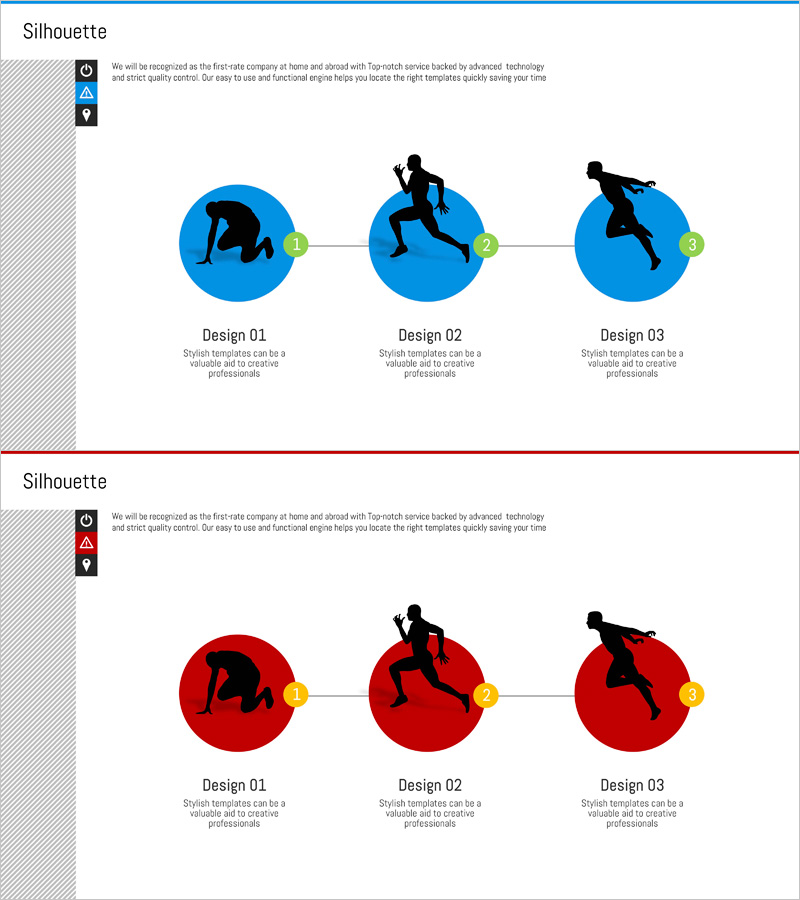
A process flow diagram PowerPoint slide featuring human silhouettes in dynamic poses within circular nodes. Available in two color versions—blue and red—this slide deck presents a three-stage progression with sequential connector lines linking each step. The 2-slide set is ready to use for business processes, growth stages, team collaboration workflows, and customer journey mapping. Delivered in 16:9 widescreen PPTX format, fully editable in all PowerPoint versions for seamless customization.
Usage Points
-
Main Usage
Visualize business processes, growth stages, team collaboration, and customer journeys through dynamic human silhouettes in three sequential steps. The silhouette poses—bending, running, jumping—add movement and energy to abstract concepts, enhancing audience comprehension.
-
How to Use
Add text labels to each stage describing the step title and details. Keep the numbered nodes (1, 2, 3) and silhouettes fixed while adjusting background colors, connector line styles, or accent colors to match your brand identity.
-
Recommended For
Ideal for strategy and planning presentations, marketing customer journey maps, HR recruitment and development stage explanations, and sales process demonstrations. Perfect for presentations requiring a creative, dynamic visual approach.
-
Slide Structure
Two-slide layout: Slide 1 features a blue background with three circular nodes containing human silhouettes in distinct poses (bending, running, jumping), connected by sequential lines. Slide 2 mirrors the structure with a red background, maintaining consistent node numbering (1, 2, 3).
Related Products
-

The Climbing Journey of a Growing Professional
#Business Vision and Strategy #Business Strategy #Diagram
-

Science Experiment Goal Arrow Diagram – Steps for Successful Projects
#Business Introduction #Business Vision and Strategy #Business Strategy
-

Implementation Plan by Business Stage – Overview and Timeline
#Business Vision and Strategy #Business Strategy #Diagram
-

Science Experiment Research Goals Diagram – Visualizing with Linear Flow
#Business Vision and Strategy #Business Strategy #Diagram
