Mobile Content Performance Analysis – Data-Driven Business Vision and Marketing Strategy
RJ0300044_20
- Last Update 04/29/2025
- File Size 0.6MB
- # of Slides 2
- File Format PPTX
- Slide Ratio 16:9
- Color
Keywords
- #Content-Based Slides
- #Design-Based Slides
- #Business Vision and Strategy
- #Marketing Plan and Strategy
- #Graph
- #Other
- #Business Goals
- #Marketing Objectives
- #Column
- #Column Chart
- #Mockup
- #16:9
- #mobile device mockup PowerPoint slide
- #column chart template
- #content performance analysis
- #mobile UI presentation
- #data visualization slide download
About the Product
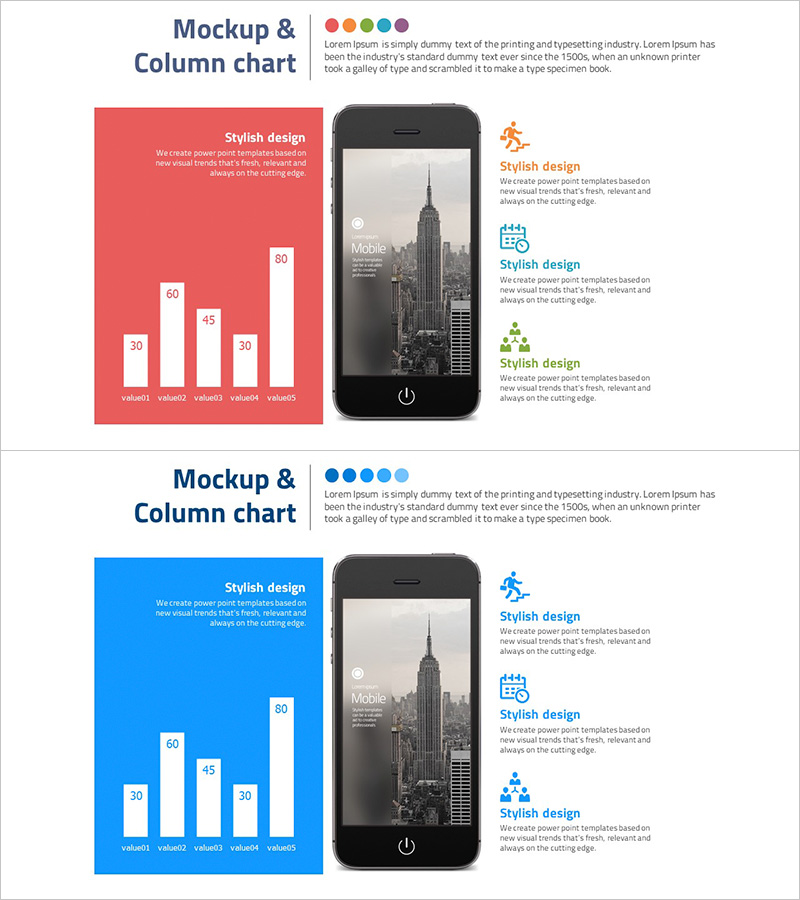
A PowerPoint slide set combining mobile device mockup with a 5-item vertical column chart for data visualization. The left side features red and blue backgrounds with bar charts displaying content performance metrics (values 30–80), while the right side shows a smartphone mockup simulating actual mobile screen implementation. Three icons on the right (runner, team, plant) symbolize key performance indicators. Ideal for business presentations, marketing strategy decks, and performance reports where mobile content metrics need data-driven explanation. Colors and values are fully editable to match your specific analytics.
Usage Points
-
Main Usage
Visualize mobile content performance metrics using a vertical column chart while simultaneously displaying actual mobile screen implementation through device mockup. Integrate quantitative data and UI prototype on a single slide to strengthen persuasiveness of mobile strategy presentations.
-
How to Use
Use in performance analysis sections of marketing strategy decks, content performance pages of business reports, and mobile app introduction presentations. Replace chart values and labels with your actual data, modify content type descriptions, and deploy immediately without additional design work.
-
Recommended For
Marketing managers, mobile app development teams, business strategists, and data analysts presenting performance reports and strategy initiatives. Particularly effective for explaining mobile content performance, app user engagement, and channel-by-channel performance comparisons.
-
Slide Structure
Slide 1: Red background with vertical 5-item column chart (values 30, 60, 45, 30, 80) and text labels. Slide 2: Blue background with identical chart structure, smartphone mockup on right (displaying city image), three icons on right (runner, team, plant) with accompanying description text areas. 16:9 aspect ratio, PPTX format.
Related Products
-

Presentation Slide Visualizing Business Achievement Goals – Strategy and Objectives
#Business Vision and Strategy #Marketing Plan and Strategy #Diagram
-

Cluster Diagram for Setting Business Goals
#Business Vision and Strategy #Marketing Plan and Strategy #Diagram
-

Enhance Your Brand with Paper Ad Mockup – Creative Marketing Strategy
#Business Vision and Strategy #Marketing Plan and Strategy #Diagram
-

Business Achievement Goals Diagram – Market Analysis and Marketing Strategy
#Market and Competitor Analysis #Marketing Plan and Strategy #Graph
