Travel Guide Market Analysis by State in the United States Using Horizontal Bar Chart
RJ0600063_12
- Last Update 07/06/2025
- File Size 1.9MB
- # of Slides 2
- File Format PPTX
- Slide Ratio 16:9
- Color
Keywords
- #Content-Based Slides
- #Design-Based Slides
- #Market and Competitor Analysis
- #Graph
- #Other
- #Market Analysis
- #Competitive Advantage
- #Horizontal Bar
- #Grouped Horizontal Bar
- #Map
- #16:9
- #US map PowerPoint slide
- #horizontal bar chart template
- #state-level data visualization
- #regional market analysis slide
- #geography comparison PPT template
About the Product
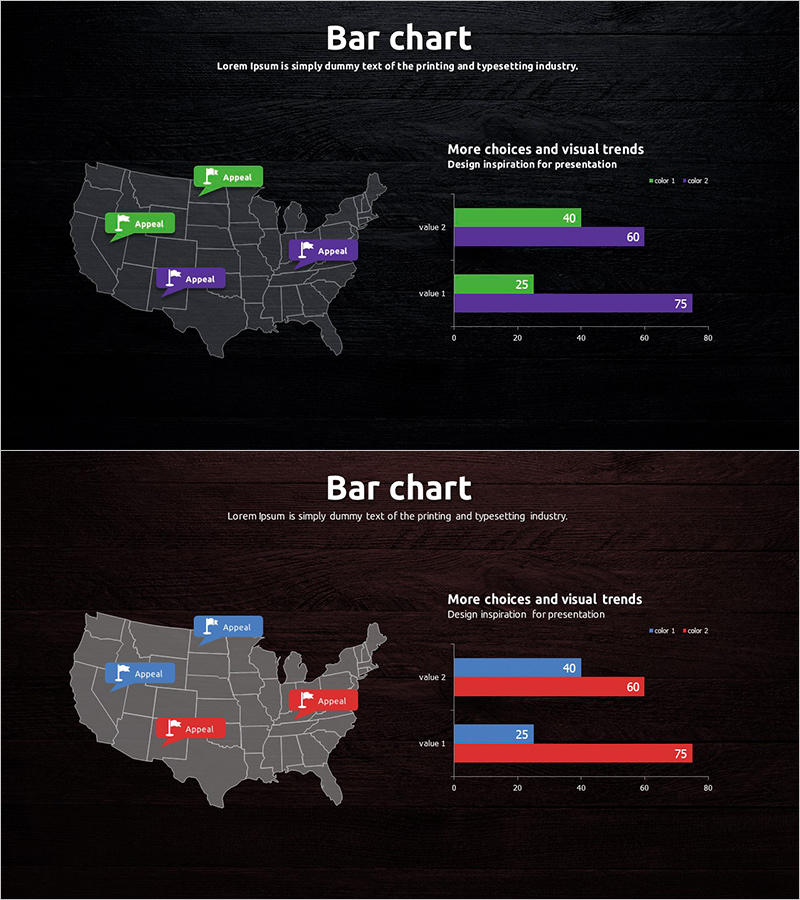
A PowerPoint slide deck combining a United States map with horizontal bar charts to compare state-level data across regions. The dark background features gray-toned geography with color-coded callout labels (green-purple and blue-red variants) highlighting specific states, while adjacent bar charts display comparative metrics with dual-series data visualization. Ideal for travel market analysis, regional sales performance, state-by-state competitive positioning, and geographic distribution reports. Two slide variations provide flexible color schemes to match presentation tone and corporate branding.
Usage Points
-
Main Usage
Simultaneously display geographic distribution and numerical comparison of state-level data using an integrated map-and-chart layout. Enables audiences to identify regional patterns, state rankings, and market concentration at a glance. Optimized for travel industry market sizing, regional sales tracking, state-by-state performance benchmarking, and location-based strategic analysis.
-
How to Use
Slide 1 features green-purple color scheme; Slide 2 offers blue-red variant. Select the color palette matching your presentation theme and corporate identity. Edit the map callout labels and bar chart values with your own regional data. Both slides are fully editable in PowerPoint, allowing quick customization of data points, labels, and formatting for immediate presentation use.
-
Recommended For
Travel and tourism market analysis, real estate and construction regional performance reports, retail and distribution state-level sales tracking, financial services geographic customer distribution, marketing teams presenting regional campaign effectiveness. Recommended for executive briefings, investor presentations, client pitches, and strategic planning meetings requiring geographic data comparison.
-
Slide Structure
Each slide contains: dark background + grayscale US map (4 highlighted states with colored callout labels) + right-aligned horizontal bar chart (2 data series, 4 value points per series, 0-80 scale). Map and chart areas are proportionally balanced to present geographic context and quantitative metrics simultaneously. Color variants maintain consistent layout and data structure across both slides.
Related Products
-

European Target Market Analysis Bar Graph – Market Vision and Opportunities
#Market and Competitor Analysis #Graph #Other
-

Market Status and Trends Horizontal Bar Chart Slide
#Market and Competitor Analysis #Graph #Other
-

Sensuous Cloud Presentation Template with World Map
#Market and Competitor Analysis #Diagram #Other
-

Audio Icons and Comparison Graphs – A New Dimension in Market Analysis
#Market and Competitor Analysis #Graph #Market Analysis
