Cybersecurity Business Market Analysis Graph
RJ0400069_19
- Last Update 06/06/2025
- File Size 1MB
- # of Slides 2
- File Format PPTX
- Slide Ratio 16:9
- Color
Keywords
- #Content-Based Slides
- #Design-Based Slides
- #Market and Competitor Analysis
- #Graph
- #Competitor Analysis
- #Market Analysis
- #Horizontal Bar
- #Grouped Horizontal Bar
- #16:9
- #horizontal bar chart PowerPoint
- #grouped bar graph template
- #2-series comparison slide
- #market analysis chart
- #competitive analysis PowerPoint
- #data visualization slide
About the Product
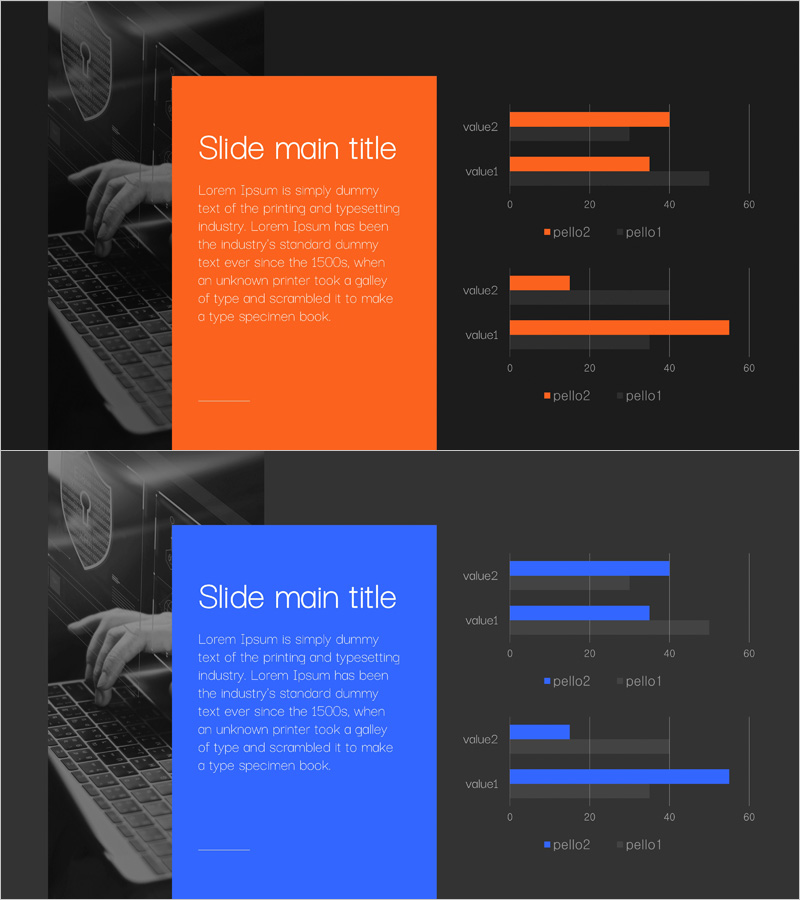
A horizontal bar chart PowerPoint slide designed to compare two data series side-by-side, ideal for cybersecurity market analysis, competitive benchmarking, and revenue comparisons. The chart uses orange and blue bars to distinguish between two data sets (pello1 and pello2), displaying values across a 0–60 scale with clear item labels. This 16:9 widescreen template includes 2 fully editable slides with balanced layouts combining title/description areas on the left and chart visualization on the right. All elements—colors, values, labels, and bar lengths—can be customized to match your presentation data.
Usage Points
-
Main Usage
Visualize and compare two related data sets—such as market size vs. competitor revenue, product A vs. product B performance, or year-over-year growth rates—in a single, easy-to-read chart. The horizontal bar layout ensures item names remain legible while emphasizing numerical comparisons.
-
How to Use
Insert this slide into business plans, market analysis reports, investor pitch decks, or quarterly performance reviews. Replace the title and description text on the left side, then update the bar chart data (item names, pello1 values, pello2 values) to reflect your analysis. Adjust bar colors and scale as needed.
-
Recommended For
Marketing managers, strategy consultants, sales executives, financial analysts, and business development teams presenting market insights, competitive positioning, or performance metrics. Particularly effective for B2B proposals, investor presentations, and executive briefings.
-
Slide Structure
2 slides with identical layout. Each slide divides the canvas into left section (orange or blue background with title and descriptive text) and right section (dark gray background with horizontal bar chart). The chart displays 4 items with 2 data series (pello1 and pello2) as grouped horizontal bars, includes a 0–60 axis scale, and features a legend identifying each series.
Related Products
-

Competitor Website Analysis Graph – Market and Competitor Analysis
#Market and Competitor Analysis #Graph #Competitor Analysis
-

Graph of Analysis of Employee Card Usage - Market and Competitor Analysis
#Market and Competitor Analysis #Graph #Competitor Analysis
-

Market Analysis Bundle Bar Graph - Effective Competitor Analysis
#Market and Competitor Analysis #Graph #Competitor Analysis
-

Medical Record Analysis Bar Graph – Market and Competitor Analysis
#Market and Competitor Analysis #Graph #Competitor Analysis
