Cluster Diagram Visualizing Korea's Network
RB0100044_5
- Last Update 03/06/2025
- File Size 1.6MB
- # of Slides 2
- File Format PPTX
- Slide Ratio 4:3
- Color
Keywords
- #Content-Based Slides
- #Design-Based Slides
- #Company Introduction
- #Business Introduction
- #Diagram
- #Other
- #Domestic Network
- #Infrastructure
- #Cluster
- #Chain Diagram
- #Map
- #4:3
- #Korea map PowerPoint slide
- #network diagram presentation
- #hub connection map
- #business infrastructure PPT
- #Korea network visualization
About the Product
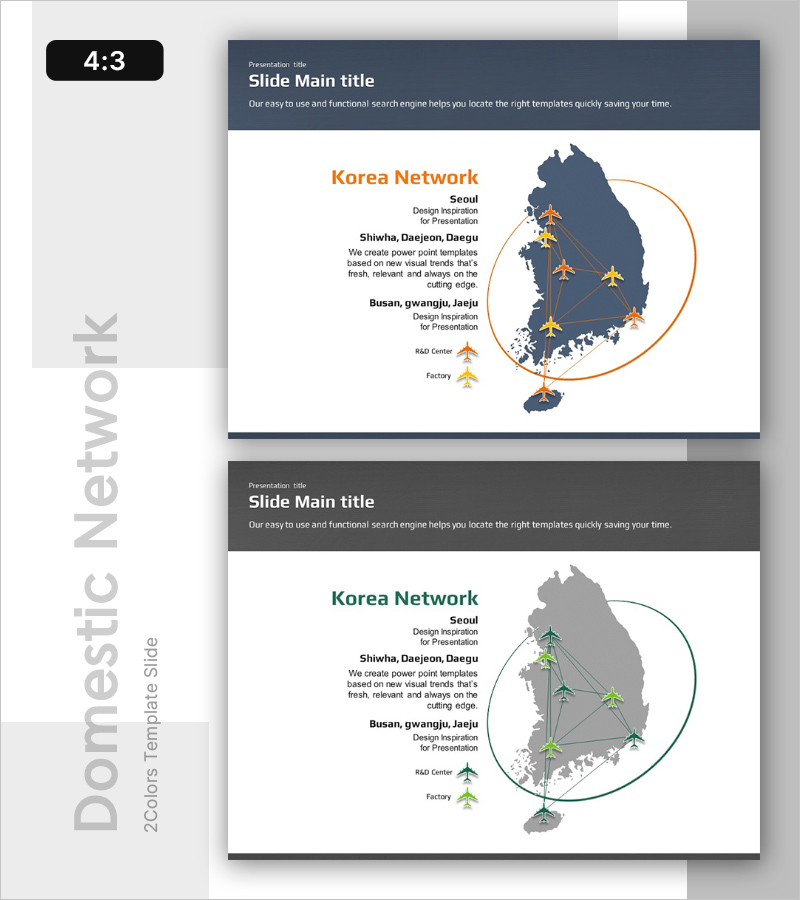
A map-based network diagram PowerPoint slide visualizing South Korea's major business hubs and regional centers. The slide features five key locations—Seoul, Suwon, Daegu, Busan, Gwangju, and Jeju—connected by linear pathways and highlighted with a circular accent line. Each hub is marked with icons and labels indicating its function (Design Center, R&D Center, Factory), creating a clear organizational hierarchy. The design uses a dark blue background with orange accent colors for strong visual contrast, making it ideal for business presentations, infrastructure reports, and network expansion strategies. Delivered in 4:3 ratio across 2 slides in editable PPTX format, allowing you to customize hub names, icons, and connection lines to match your company's specific network structure.
Usage Points
-
Main Usage
Visualizes a company's domestic business hubs, distribution networks, and production facilities across South Korea using a geographic map foundation. Connection lines between hubs represent supply chains, logistics flows, and partnership relationships, while icons and text labels distinguish each hub's operational role, enabling stakeholders to grasp the company's regional footprint at a glance.
-
How to Use
Insert this slide into company profile presentations (business overview section), investor pitch decks (infrastructure and expansion strategy slides), and business plans (domestic growth roadmap). Customize hub names, modify line thickness and colors to emphasize key locations, and adjust icon types to reflect your company's specific functions at each site.
-
Recommended For
Executives presenting business expansion plans, regional business managers reporting operational status, supply chain and logistics teams visualizing distribution networks, and startup or mid-sized company representatives seeking investment based on domestic infrastructure strength.
-
Slide Structure
Two-slide set with dark blue header sections containing title and descriptive text, followed by a main content area featuring a South Korea map. Five hubs are positioned as nodes on the map, connected by orange lines representing network relationships. A circular accent line highlights the primary hub region. Text boxes adjacent to each hub display location names and functional roles, creating clear information hierarchy and visual organization.
Related Products
-

Visualizing Local Routes in a Business Diagram
#Company Introduction #Business Introduction #Diagram
-

Global Infrastructure Slide – Visualizing Global Networks
#Company Introduction #Business Introduction #Diagram
-

Infrastructure and Regional Marketing Strategies – Data Visualization Template
#Company Introduction #Business Introduction #Graph
-

Graph of Analysis by Year in the Americas – Infrastructure and Business Strategy
#Company Introduction #Business Introduction #Graph
