Visualizing Local Routes in a Business Diagram
RJ0600058_11
- Last Update 07/06/2025
- File Size 1.8MB
- # of Slides 2
- File Format PPTX
- Slide Ratio 16:9
- Color
Keywords
- #Content-Based Slides
- #Design-Based Slides
- #Company Introduction
- #Business Introduction
- #Diagram
- #Other
- #Domestic Network
- #Infrastructure
- #Cluster
- #Chain Diagram
- #Map
- #16:9
- #US map PowerPoint slide
- #regional route visualization
- #business network diagram
- #location connection slide
- #geographic expansion strategy
- #5-point network map
About the Product
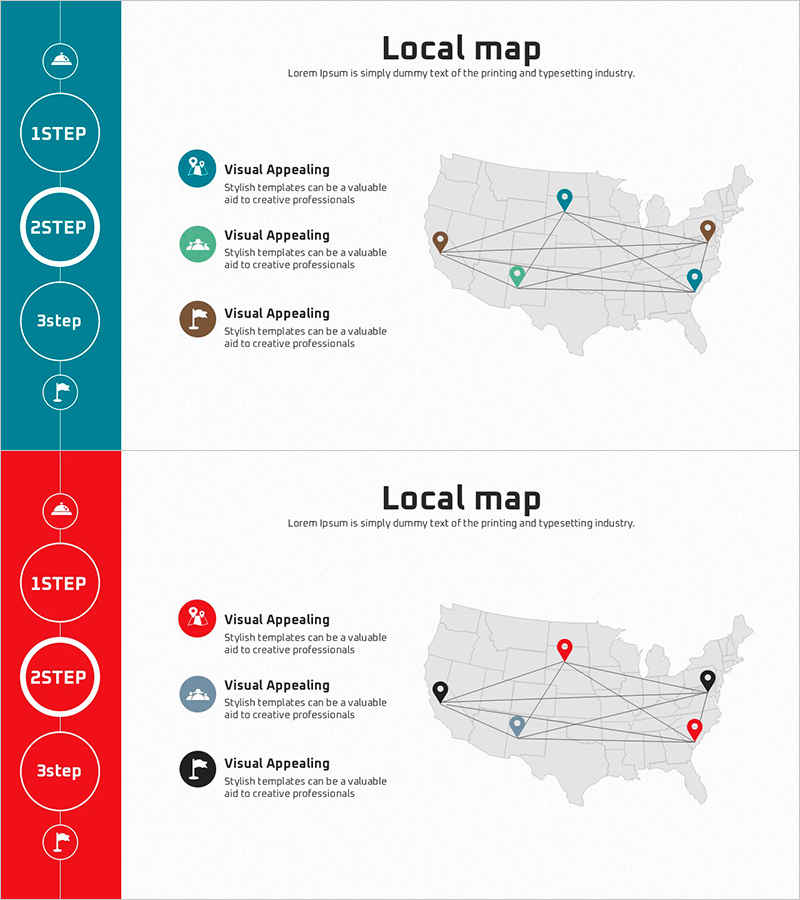
A PowerPoint slide that visualizes regional movement routes across the United States with five key locations connected by lines. The gray background map displays colored pins marking business hubs, distribution centers, or expansion points, with connecting lines showing network flow and relationships. A vertical timeline on the left (1STEP–3step) and an icon legend on the right clarify sequential progress and role differentiation at each location. Provided in two color themes (teal and red) to match presentation tone, this 16:9 widescreen PPTX slide is fully editable and ready for immediate use in business reports, marketing plans, and investor presentations.
Usage Points
-
Main Usage
Communicate regional expansion strategies, distribution networks, market penetration routes, and multi-location business operations through geographic visualization. Ideal for business reports, marketing strategy presentations, investor pitch decks, and quarterly performance reviews where location-based growth and network connectivity are key messages.
-
How to Use
Populate the left vertical timeline with phase labels (1STEP–3step) and corresponding milestones. Update the right-side icon legend with location-specific roles and descriptions. Reposition map pins and connecting lines to match your organization's actual geographic footprint and network structure for a customized regional strategy diagram.
-
Recommended For
Regional business managers, marketing strategy teams, sales operations leaders, and executives preparing geographic expansion or distribution network presentations. Best suited for business plans, quarterly business reviews, regional growth strategy pitches, and supply chain or market entry presentations.
-
Slide Structure
Two-slide set. Each slide features a left vertical timeline (4 circular nodes with connecting line), center title area, and right side with US map (gray background), 5 colored location pins (teal, brown, green, blue), connecting network lines, and 3-item icon legend. Available in teal and red color themes.
Related Products
-

Cluster Diagram Visualizing Korea's Network
#Company Introduction #Business Introduction #Diagram
-

Graph of Analysis by Year in the Americas – Infrastructure and Business Strategy
#Company Introduction #Business Introduction #Graph
-

Global Infrastructure Slide – Visualizing Global Networks
#Company Introduction #Business Introduction #Diagram
-

Key Regional Hubs Visualization – Showcasing Enhanced Connectivity
#Company Introduction #Market and Competitor Analysis #Diagram
