Visualizing South Korea's Market Share – Data-Driven Insights
RB0800002_5
- Last Update 03/17/2025
- File Size 0.3MB
- # of Slides 2
- File Format PPTX
- Slide Ratio 4:3
- Color
Keywords
- #Content-Based Slides
- #Design-Based Slides
- #Company Introduction
- #Market and Competitor Analysis
- #Graph
- #Other
- #Domestic Network
- #Market Share
- #Circles
- #Doughnut Chart
- #Map
- #4:3
- #South Korea map PowerPoint slide
- #regional marker presentation
- #donut chart slide template
- #market share visualization
- #geographic data PPT
About the Product
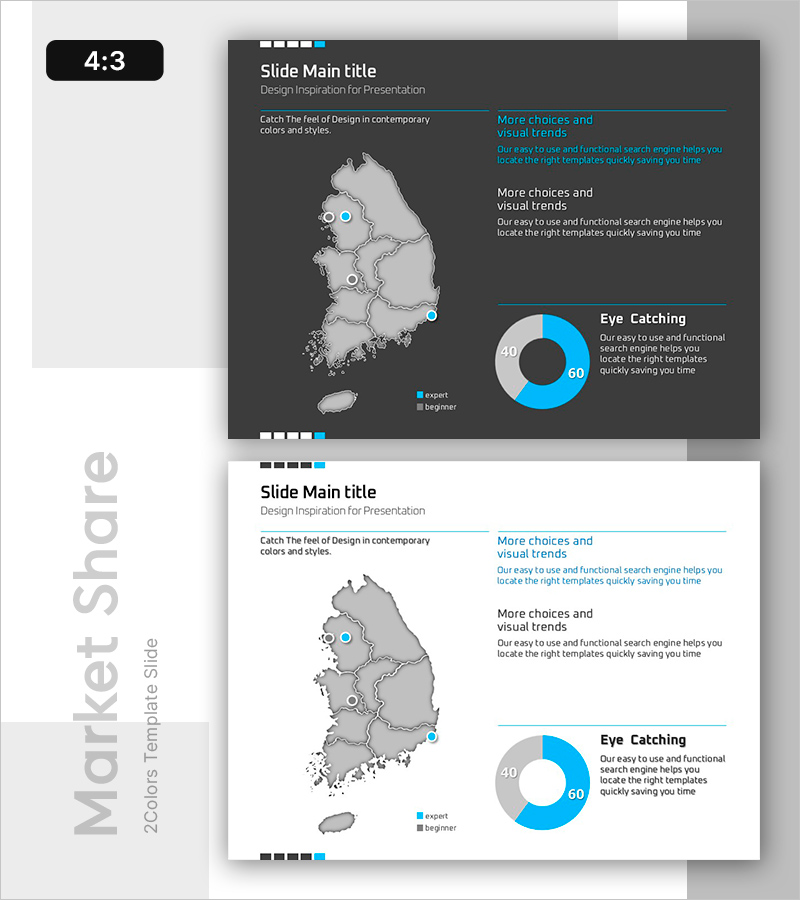
A PowerPoint slide combining a South Korea map with 5 regional markers and a donut chart to visualize market share data. The dark background with cyan blue accent colors creates a professional, data-focused presentation style. Circular markers are positioned on the map with text labels, while the donut chart on the right displays percentage distribution. Perfect for market analysis presentations, regional sales reports, and business performance briefings. Includes 2 slides in 4:3 aspect ratio.
Usage Points
-
Main Usage
Combines geographic location data with quantitative metrics by placing regional markers on a South Korea map and displaying corresponding percentages in a donut chart. Effectively communicates market distribution, regional sales performance, or customer concentration across different areas simultaneously.
-
How to Use
Edit marker positions and sizes to match your actual regional data. Update donut chart values and legend labels to reflect current metrics. Customize text labels for each region. The dark background with cyan accents maintains professional appearance while ensuring data clarity and visual hierarchy.
-
Recommended For
Marketing managers presenting regional market analysis, sales teams reporting regional performance, executives reviewing business status, consulting firms proposing regional strategies. Ideal for any business presentation requiring simultaneous display of geographic and quantitative information.
-
Slide Structure
Slide 1: Dark background with gray-toned South Korea map, 5 cyan blue circular markers at regional locations, donut chart on right side (60% cyan, 40% gray), legend showing Expert/Beginner categories. Slide 2: Light background version with identical layout. All elements are fully editable vector objects.
Related Products
-

Global Architectural Donut Chart – Market Share Visualization
#Market and Competitor Analysis #Graph #Other
-

Geometry PPT Template Wide Map & Doughnut Chart
#Market and Competitor Analysis #Graph #Other
-

Green Orange Market Share Visualization – Data-Driven Insights
#Market and Competitor Analysis #Graph #Other
-

Doughnut Chart Visualizing Market Share by Exercise
#Business Introduction #Market and Competitor Analysis #Graph
