Doughnut Chart for Visualizing Key Achievements – Quality Presentation
RJ0200020_9
- Last Update 04/03/2025
- File Size 6.2MB
- # of Slides 2
- File Format PPTX
- Slide Ratio 16:9
- Color
Keywords
- #Content-Based Slides
- #Design-Based Slides
- #Company Introduction
- #Product/Service Introduction
- #Graph
- #Key Achievements
- #Development Status
- #Circles
- #Doughnut Chart
- #16:9
- #doughnut chart PowerPoint
- #pie chart slide template
- #ratio visualization PPT
- #performance metrics presentation
- #doughnut graph slide design
About the Product
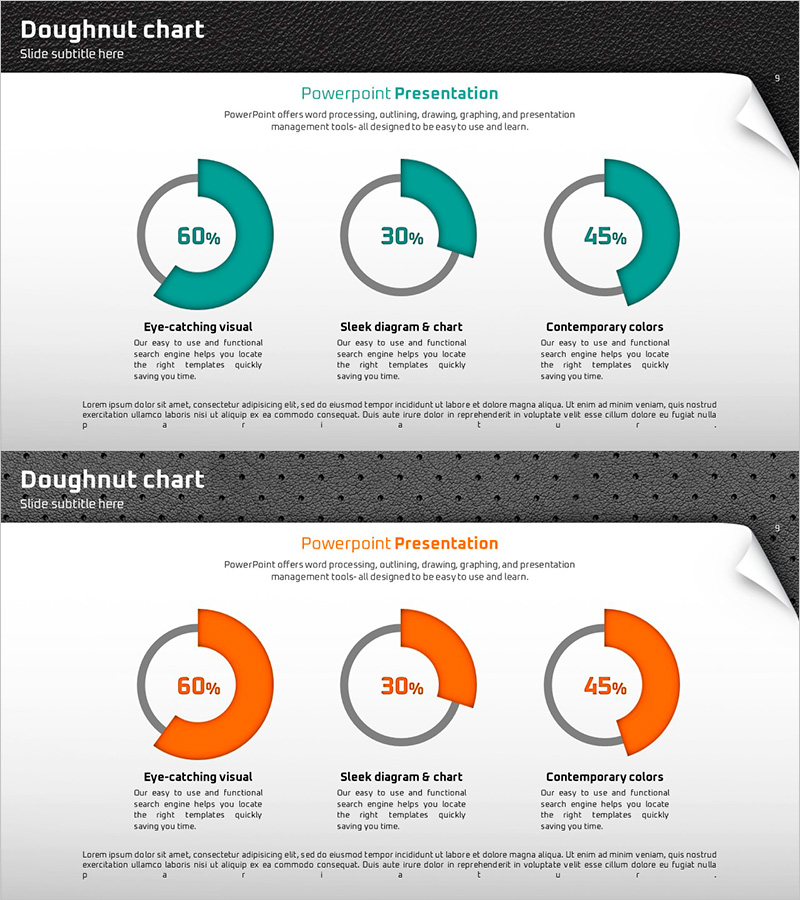
A professional PowerPoint slide featuring doughnut charts to visualize key performance metrics and data ratios. The design uses a teal and gray two-tone background with three segments displayed as circular doughnut shapes, each labeled with percentage values in the center. Ideal for product introductions, performance analysis, marketing statistics, and business presentations. The set includes 2 slides with color variations (teal and orange) that can be instantly adapted to your corporate brand guidelines. Formatted in 16:9 widescreen PPTX for seamless integration into modern presentation environments.
Usage Points
-
Main Usage
Doughnut charts effectively communicate proportional relationships by displaying segments as a circular graph with percentage values. This slide template presents three data segments with clear numerical labels, making it ideal for illustrating product feature composition, market share distribution, budget allocation, customer satisfaction scores, and other quantitative performance metrics in a visually compelling format.
-
How to Use
Open the slide and replace the percentage values and segment labels with your own data. The color scheme can be customized to match your corporate brand identity, and two color variations (teal and orange) are provided for flexibility across different presentation sections or topics. The gray background and white center area naturally emphasize the data without requiring additional design adjustments.
-
Recommended For
Marketing professionals, financial analysts, product managers, and executives preparing business reports. Suitable for business performance analysis, product introduction presentations, marketing statistics briefings, investor relations meetings, quarterly performance reviews, and data-driven decision-making communications.
-
Slide Structure
The 2-slide set features one doughnut chart per slide with 3-segment divisions. The first slide displays a teal-colored doughnut (with example values of 60%, 30%, 45%), while the second slide shows an orange variant for color flexibility. Each doughnut includes centered percentage labels, with segment names and descriptive text areas positioned below for additional context.
Related Products
-

Newspaper Wide PowerPoint Template with Donut Chart for Key Achievements
#Company Introduction #Product/Service Introduction #Graph
-

Doughnut Chart Slide for Dynamic Data Presentation – Vision of Achievement
#Company Introduction #Product/Service Introduction #Graph
-

Visualizing Bicycle Performance with Donut Chart
#Company Introduction #Product/Service Introduction #Graph
-

Donut Diagram Visualizing Technology Development Status
#Company Introduction #Product/Service Introduction #Diagram
