Geometry PowerPoint Template Wide Donut Chart1
RJ0200034_5
- Last Update 04/07/2025
- File Size 0.1MB
- # of Slides 2
- File Format PPTX
- Slide Ratio 16:9
- Color
Keywords
- #Content-Based Slides
- #Design-Based Slides
- #Company Introduction
- #Product/Service Introduction
- #Graph
- #Key Achievements
- #Development Status
- #Circles
- #Doughnut Chart
- #16:9
- #donut chart PowerPoint
- #pie chart slide template
- #ratio visualization
- #4-section donut chart
- #data visualization PowerPoint
- #graph presentation template download
About the Product
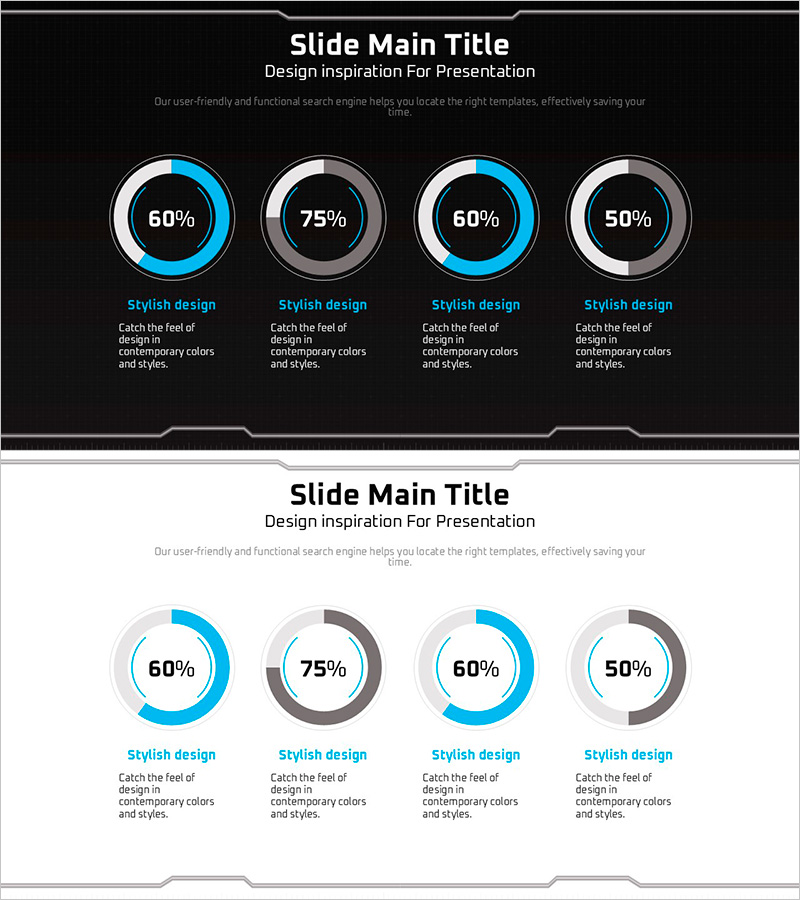
A professional donut chart PowerPoint slide optimized for ratio visualization with four-section data representation. Designed with a black background and blue-gray dual-tone color scheme to enhance data clarity and visual impact. Each chart includes descriptive text areas below for data interpretation. The 2-slide set enables side-by-side comparison of multiple ratio datasets, formatted in 16:9 widescreen for modern presentation environments. Ready-to-use for business reports, financial presentations, marketing analysis, and performance reviews.
Usage Points
-
Main Usage
Effectively visualizes proportional data divided into four categories using donut chart format. Ideal for presenting market share, budget allocation, customer demographics, revenue distribution, and composition percentages. Descriptive text areas below each chart reinforce numerical interpretation and context.
-
How to Use
Four donut charts are arranged in a 2×2 grid layout on a black background. Edit the numerical values and colors of each chart to input your actual data, then add category names and descriptions in the text areas below. The blue-gray color combination maintains professional appearance throughout your presentation.
-
Recommended For
Financial analysis, marketing reports, business performance reviews, investor presentations, customer analytics, and quarterly business updates. Recommended for executives, data analysts, marketing professionals, and consultants presenting data-driven insights.
-
Slide Structure
2-slide set with four donut charts per slide arranged in 2×2 grid format. Each chart features center value display, color-coded outer segments, and descriptive text area below. Formatted in 16:9 widescreen aspect ratio for optimal display on modern presentation systems.
Related Products
-

Infographic Design Wide Template Donut Chart – A Fusion of Trust and Innovation
#Company Introduction #Product/Service Introduction #Graph
-

Visualizing Bicycle Performance with Donut Chart
#Company Introduction #Product/Service Introduction #Graph
-

Doughnut Chart for Visualizing Key Achievements – Quality Presentation
#Company Introduction #Product/Service Introduction #Graph
-

Doughnut Chart Slide for Dynamic Data Presentation – Vision of Achievement
#Company Introduction #Product/Service Introduction #Graph
