Little Witch and Donut Chart – Visualizing Achievements in Presentation Slide
RJ0500033_19
- Last Update 06/16/2025
- File Size 1MB
- # of Slides 2
- File Format PPTX
- Slide Ratio 16:9
- Color
Keywords
- #Content-Based Slides
- #Design-Based Slides
- #Company Introduction
- #Product/Service Introduction
- #Graph
- #Key Achievements
- #Development Status
- #Circles
- #Doughnut Chart
- #16:9
- #donut chart PowerPoint slide
- #pie chart template
- #3-segment ratio visualization
- #performance metrics presentation
- #circular graph slide download
About the Product
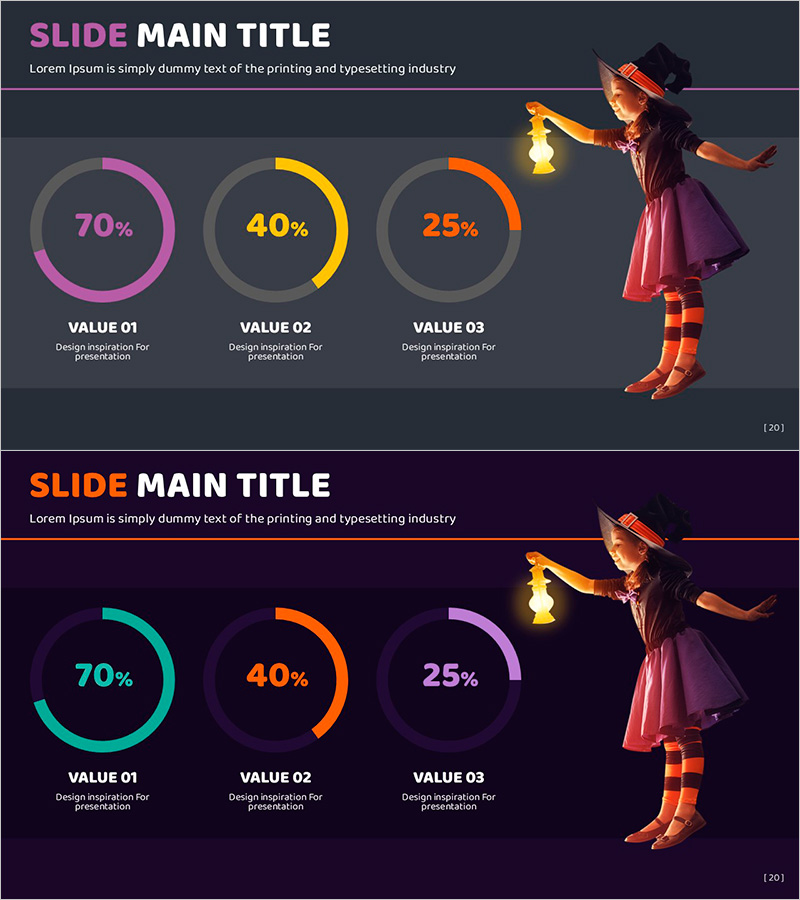
A PowerPoint slide featuring three donut charts displaying proportional data (70%, 40%, 25%) in magenta, yellow, and orange. The little witch character illustration adds visual interest and warmth to business presentations. This 16:9 widescreen 2-slide set is ready to use for performance reports, analytics dashboards, marketing metrics, and achievement summaries. All chart segments, percentages, and labels are fully editable to match your data and presentation needs.
Usage Points
-
Main Usage
Visualize and compare three data segments or performance metrics at a glance using donut chart format. The magenta, yellow, and orange color contrast makes each value instantly recognizable, while the character illustration creates an approachable, engaging presentation tone.
-
How to Use
Apply to quarterly results, departmental performance, marketing channel attribution, customer satisfaction ratings, or budget allocation comparisons. Double-click chart segments to edit percentages and labels. Modify colors via the Design tab to match your brand guidelines.
-
Recommended For
Sales, marketing, and planning teams presenting monthly or quarterly performance reports. Ideal for executive briefings, investor presentations, team meetings, and workshop discussions. Suitable for any data-driven business presentation requiring clear ratio comparison.
-
Slide Structure
Slide 1: Title area (magenta and white text, top-left) + subtitle + three donut charts (magenta 70%, yellow 40%, orange 25%, left to right) + little witch character (right side). Slide 2: Variant layout with darker background and alternate donut colors (cyan, orange, purple). All shapes and text are fully editable.
Related Products
-

Doughnut Chart for Visualizing Key Achievements – Quality Presentation
#Company Introduction #Product/Service Introduction #Graph
-

Visualizing Simple Design Trend with Donut Chart PPT
#Company Introduction #Product/Service Introduction #Graph
-

Geometry PowerPoint Template Wide Donut Chart1
#Company Introduction #Product/Service Introduction #Graph
-

Doughnut Chart Slide for Dynamic Data Presentation – Vision of Achievement
#Company Introduction #Product/Service Introduction #Graph
