Performance Achievement Status Illustrated with Doughnut Chart Slide
RB0800043_6
- Last Update 03/25/2025
- File Size 4.3MB
- # of Slides 2
- File Format PPTX
- Slide Ratio 4:3
- Color
Keywords
- #Content-Based Slides
- #Design-Based Slides
- #Company Introduction
- #Market and Competitor Analysis
- #Graph
- #Key Achievements
- #Market Share
- #Circles
- #Doughnut Chart
- #4:3
- #doughnut chart PowerPoint slide
- #pie chart template download
- #performance metrics visualization
- #market share presentation
- #data comparison slide design
About the Product
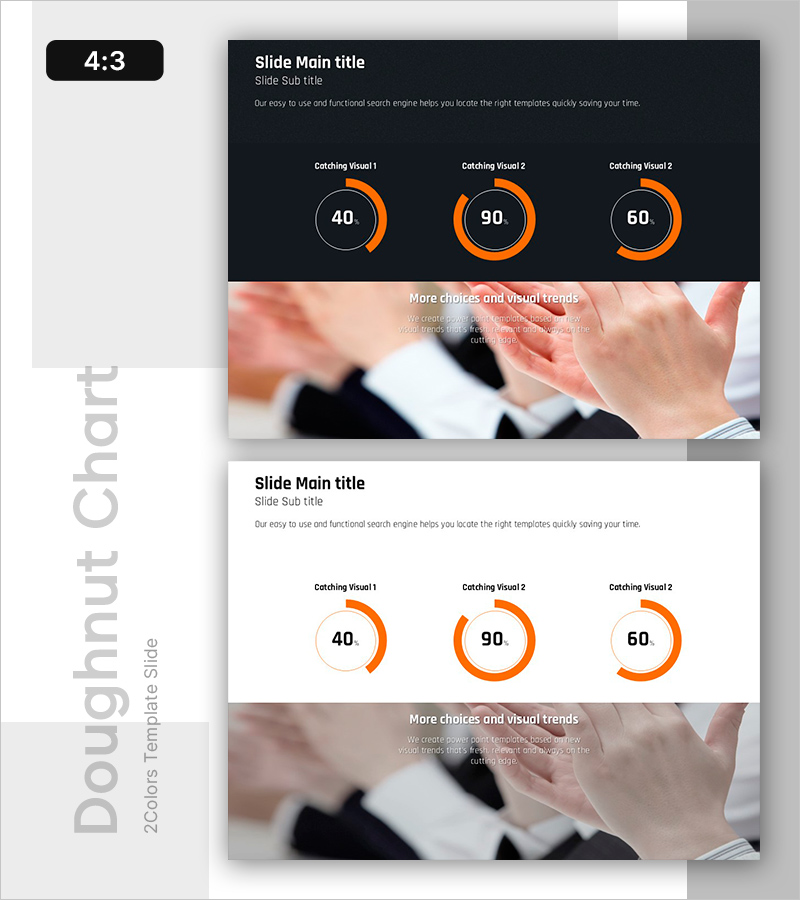
A professional doughnut chart PowerPoint slide designed to visualize performance achievement status and market share data. This presentation template features three doughnut charts arranged in a three-column layout on a dark background with orange accent colors, displaying numerical values (40, 90, 60) for easy comparison. The slide includes title and subtitle areas for context, making it ideal for business reports, quarterly performance reviews, and data-driven presentations. Both dark and light background versions are included for flexible presentation environments.
Usage Points
-
Main Usage
Effectively compare up to three key performance indicators (KPIs) or market metrics simultaneously using doughnut chart visualization. Each chart represents an independent data point, making it ideal for multi-metric analysis and comparative performance reporting.
-
How to Use
Enter your presentation title and subtitle in the header area. Customize each doughnut chart's numerical values and labels to match your data. The orange accent color highlights important metrics, while the dark background ensures high visibility in projection environments. Edit text fields directly in PowerPoint.
-
Recommended For
Business performance reports, quarterly earnings presentations, marketing analytics, financial status updates, market share comparisons, and goal achievement assessments. Suitable for executives, marketing managers, financial analysts, and business consultants presenting quantitative data.
-
Slide Structure
Two-slide layout: Slide 1 features a dark background with three doughnut charts in a three-column arrangement (values: 40, 90, 60). Slide 2 presents the same chart design on a light background for versatile presentation settings. 4:3 aspect ratio compatible with all standard projectors and display systems.
Related Products
-

Red Sky Donut Chart – Market Share Analysis
#Company Introduction #Market and Competitor Analysis #Graph
-

Visualization of Traditional Items Proportion – Market Share Analysis
#Company Introduction #Market and Competitor Analysis #Graph
-

Rhombus Doughnut Chart PowerPoint Template – Performance and Market Share Analysis
#Company Introduction #Market and Competitor Analysis #Graph
-

Doughnut Chart for Market Share Analysis – Performance and Trends
#Company Introduction #Market and Competitor Analysis #Graph
