Newspaper Wide PowerPoint Template with Donut Chart for Key Achievements
RJ0200046_23
- Last Update 04/11/2025
- File Size 1.2MB
- # of Slides 2
- File Format PPTX
- Slide Ratio 16:9
- Color
Keywords
- #Content-Based Slides
- #Design-Based Slides
- #Company Introduction
- #Product/Service Introduction
- #Graph
- #Key Achievements
- #Development Status
- #Circles
- #Doughnut Chart
- #16:9
- #donut chart PowerPoint slide
- #pie chart template
- #4-item circular graph
- #performance metrics visualization
- #ratio chart slide
- #graph PowerPoint design
About the Product
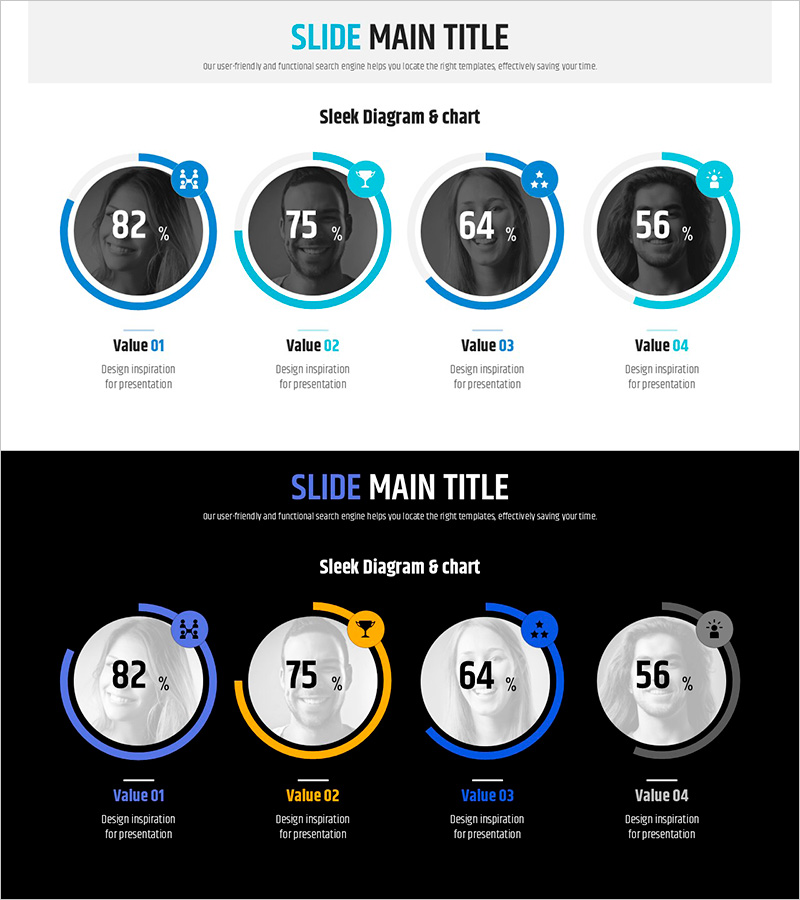
A PowerPoint slide featuring four donut charts to visualize performance metrics and data ratios. Each chart displays percentage values in the center with blue, yellow, and gray accent rings to distinguish categories. Icons positioned above each chart provide intuitive category identification, while description text areas below support detailed explanations. Ideal for company overviews, product introductions, and performance reports. The 16:9 widescreen layout adapts to modern presentation environments, and the fully editable PPTX format allows quick customization of data, colors, and labels.
Usage Points
-
Main Usage
Display and compare four key performance indicators, sales ratios, market share, or customer satisfaction scores at a glance. The donut chart format intuitively represents the relationship between whole and parts, while icons above each chart clearly distinguish categories and enhance visual comprehension.
-
How to Use
Replace percentage values with actual data, update item names and descriptions in the text areas below each chart, and swap or recolor icons to match your categories. Customize the blue, yellow, and gray accent rings to align with your organization's brand colors for a cohesive presentation.
-
Recommended For
Executive reports, quarterly performance presentations, product sales updates, customer satisfaction surveys, market analysis documents, and company overview presentations. Recommended for managers, analysts, and marketing professionals who need to communicate quantitative data effectively.
-
Slide Structure
Two-slide layout. First slide features four donut charts on a light background arranged horizontally with icons above each chart. Second slide presents the same structure on a dark background, providing contrast options. Each donut chart includes centered percentage values and text areas below for item names and descriptions.
Related Products
-

Hologram Donut Chart PPT for Visualizing Key Achievements
#Company Introduction #Product/Service Introduction #Graph
-

Infographic Design Wide Template Donut Chart – A Fusion of Trust and Innovation
#Company Introduction #Product/Service Introduction #Graph
-

Donut Charts in 4 Fields – Effective Performance Visualization
#Company Introduction #Product/Service Introduction #Graph
-

Doughnut Chart for Visualizing Key Achievements – Quality Presentation
#Company Introduction #Product/Service Introduction #Graph
