Identity Presentation Wide Company Overview – Rich Information Delivery
RJ0200003_5
- Last Update 03/29/2025
- File Size 0.3MB
- # of Slides 2
- File Format PPTX
- Slide Ratio 16:9
- Color
Keywords
About the Product
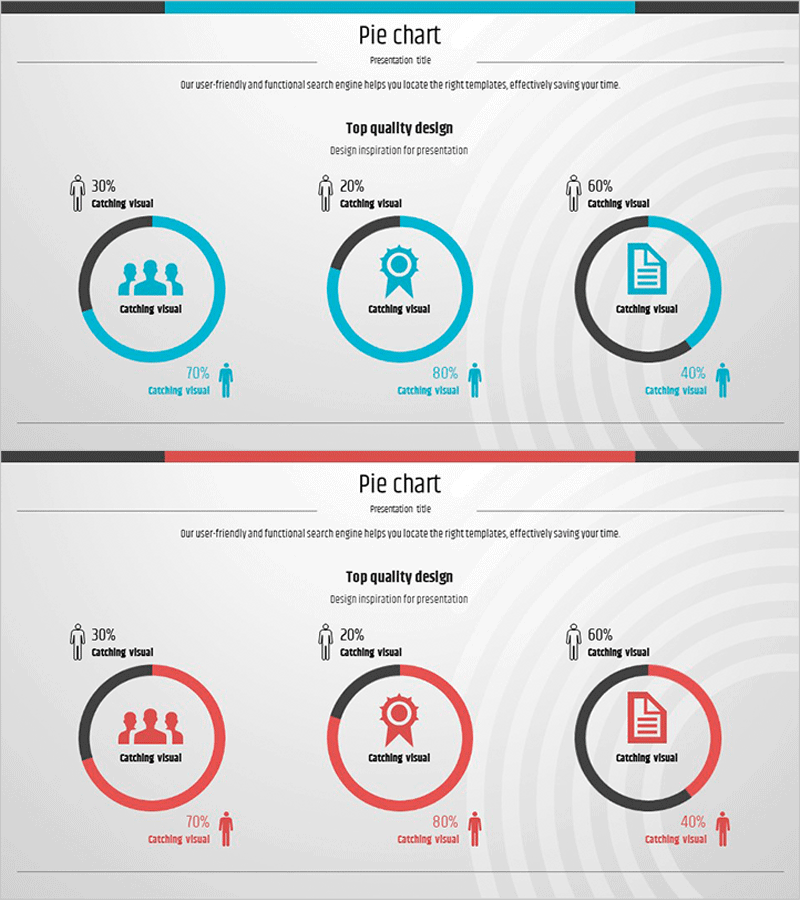
A professional donut chart PowerPoint slide designed to present company overview and key metrics with visual clarity. This 2-slide set features dual-color themes in blue and red, each displaying a three-segment donut chart with concentric ring structure. Central icons (people, gear, document) symbolize each section's meaning, while percentage values at the top and descriptive text at the bottom create a clear information hierarchy. Formatted in 16:9 widescreen ratio for modern presentation environments, fully editable in PPTX format for seamless customization and immediate use.
Usage Points
-
Main Usage
Visualize the proportional relationships of three key metrics—such as company composition, business segments, market share, or customer distribution—using an intuitive donut chart format. The central icon reinforces each section's meaning, enabling audiences to grasp data relationships quickly and enhancing presentation impact.
-
How to Use
Edit the donut chart colors and percentage values in the slide master to match your actual data. Customize the title and descriptive text fields to clarify each section's meaning. Replace the central icon with alternative imagery if needed to align with your presentation context and branding.
-
Recommended For
Executive briefings, investor presentations, business overview sessions, marketing analytics reports, and organizational structure introductions. Particularly effective for finance, marketing, and HR departments presenting three-component ratio analysis and comparative metrics.
-
Slide Structure
Two-slide set with identical donut chart layout. Each slide contains one central icon, a three-segment donut ring visualization, percentage values displayed at the top (30%, 20%, 60%), and descriptive text area at the bottom. Available in two color themes: blue and red series.
Related Products
-

Project Key Performance Charts – Highlighting Core Achievements
#Company Introduction #Graph #Company Overview
-

Curved Theme Purple Template Donut Chart – A Stylish Choice for Market Analysis
#Company Introduction #Market and Competitor Analysis #Graph
-

Colors Theme Presentation Template Donut Chart – Visualizing Company Performance
#Company Introduction #Business Introduction #Graph
-

Simple & Modern PPT Slide with Donut Chart
#Company Introduction #Business Introduction #Graph
