Target Country Market Share Analysis Graph
RJ0300094_12
- Last Update 05/15/2025
- File Size 2.3MB
- # of Slides 2
- File Format PPTX
- Slide Ratio 16:9
- Color
Keywords
- #Content-Based Slides
- #Design-Based Slides
- #Market and Competitor Analysis
- #Graph
- #Other
- #Market Share
- #Target Market
- #Circles
- #Doughnut Chart
- #Map
- #16:9
- #world map PowerPoint slide
- #donut chart presentation
- #market share analysis graph
- #regional data visualization
- #global market analysis slide template
About the Product
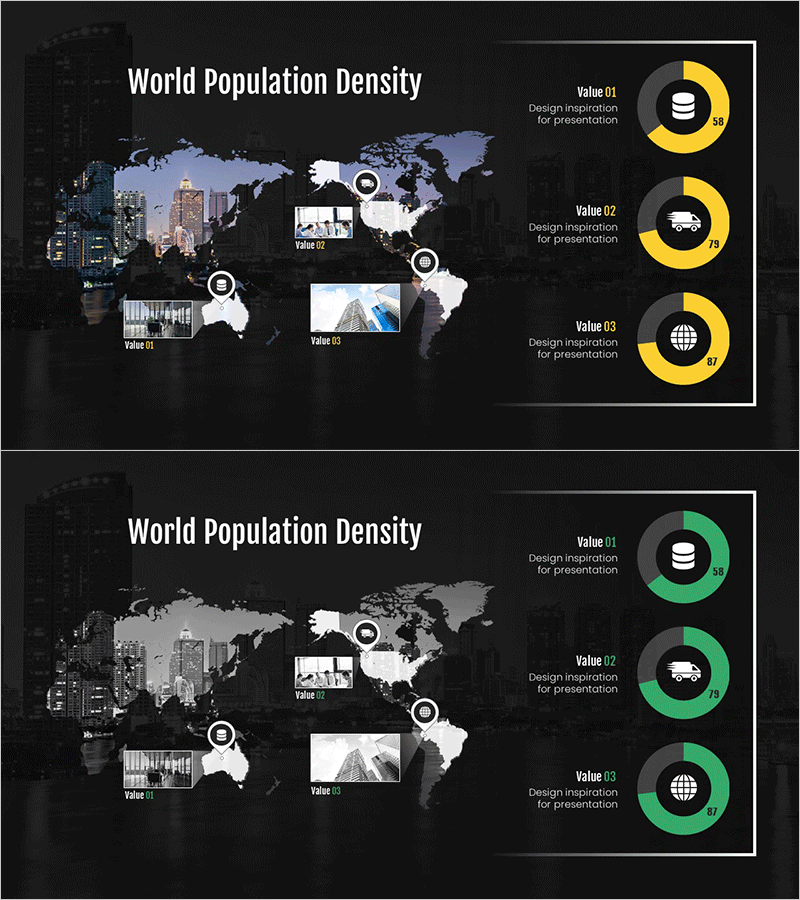
A PowerPoint slide that visualizes global market share by overlaying donut charts on a world map. Against a dark background, yellow and green donut graphs represent data for three regions, accompanied by city images for each area to convey specific market conditions. Designed for presentations and business analysis documents to compare market share by country and region at a glance. The 2-slide set provides color variations (yellow and green) that can be customized to match your corporate brand identity.
Usage Points
-
Main Usage
Analyzes global market conditions by region and country while presenting market share comparisons. The donut chart format clearly expresses each region's proportion, while the world map background simultaneously conveys geographic context, supporting decision-making during international business strategy development.
-
How to Use
Use in investor pitch decks, business reports, and marketing strategy documents within the market analysis section. Replace chart values and labels with actual data, and modify regional images as needed to emphasize specific market conditions. The dark background maintains high readability in projector presentation environments.
-
Recommended For
Recommended for international business managers, marketing strategy teams, executive report writers, and global market analysis consultants. Particularly effective for multinational corporations presenting regional performance analysis, new market entry strategies, and competitive market share comparisons.
-
Slide Structure
2-slide set with the first slide featuring three yellow donut charts and the second featuring three green donut charts positioned on the world map. Each chart is placed circularly over its corresponding region with a numeric input area in the center and 'Value 01~03' labels with description text fields at the bottom.
Related Products
-

Orange Hexagon Template World Map – Market Analysis Insights
#Market and Competitor Analysis #Graph #Other
-

Donut Chart in Overseas Markets – Market Share Analysis
#Market and Competitor Analysis #Graph #Other
-

Donut Chart Slide Visualizing Crime Frequency by Region
#Market and Competitor Analysis #Graph #Other
-

Share Chart by Region – Market Analysis Tool
#Market and Competitor Analysis #Graph #Other
