Analysis of Target Market Construction Status – Data Visualization Tool
RJ0300094_25
- Last Update 05/15/2025
- File Size 2.5MB
- # of Slides 2
- File Format PPTX
- Slide Ratio 16:9
- Color
Keywords
- #Content-Based Slides
- #Design-Based Slides
- #Market and Competitor Analysis
- #Graph
- #Other
- #Market Share
- #Target Market
- #Circles
- #Doughnut Chart
- #16:9
- #donut chart PowerPoint slide
- #pie chart data visualization
- #market share presentation template
- #regional analysis infographic
- #how to create donut chart in PowerPoint
About the Product
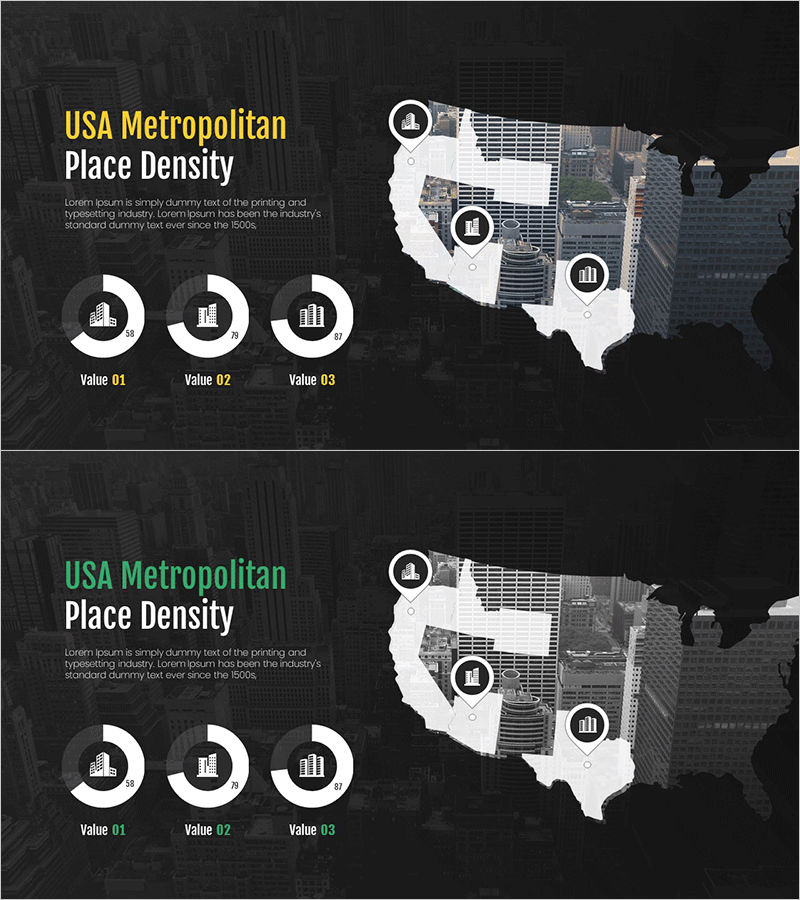
A donut chart PowerPoint slide visualizing metropolitan population density and market conditions across USA regions. The three-segment pie graph effectively represents market share, regional distribution, and compositional ratios with intuitive visual hierarchy. Dark background with white typography and yellow-green accent colors creates strong contrast, while location pins on the map highlight key metropolitan areas. Delivered as 2 slides in 16:9 widescreen format, fully editable PPTX file for immediate customization and data integration.
Usage Points
-
Main Usage
Visualize market research, regional analysis, and demographic data using donut charts to communicate proportions and composition clearly. Three color-coded segments enable instant recognition of category distribution, while map pins emphasize geographic characteristics and metropolitan concentration.
-
How to Use
Apply in business plans, market analysis reports, and investment proposals within market overview sections. Edit donut chart values to input actual data, adjust map pin locations and labels to highlight target regions, and customize color schemes to match corporate branding.
-
Recommended For
Marketing professionals, business analysts, consultants, and real estate/construction specialists explaining regional market size and share. Ideal for executive briefings, investor pitches, and strategic planning meetings requiring data-backed decision support.
-
Slide Structure
Slide 1: Title area (upper left) with 3-segment donut chart (center) and USA map with 3 location pins (right side). Slide 2: Identical layout with color variation (yellow to green accent shift). Both slides maintain dark background with white typography and icon consistency throughout.
Related Products
-

Lighting Graph – Market Share and Target Analysis
#Market and Competitor Analysis #Graph #Other
-

Donut Chart Slide Visualizing Target Market Development Status
#Market and Competitor Analysis #Graph #Other
-

Target Country Market Share Analysis Graph
#Market and Competitor Analysis #Graph #Other
-

European Target Market Status Graph – Market Share Insights
#Market and Competitor Analysis #Graph #Other
