Donut Chart Slide Visualizing Target Market Development Status
RJ0300092_17
- Last Update 05/15/2025
- File Size 1.1MB
- # of Slides 2
- File Format PPTX
- Slide Ratio 16:9
- Color
Keywords
- #Content-Based Slides
- #Design-Based Slides
- #Market and Competitor Analysis
- #Graph
- #Other
- #Market Share
- #Target Market
- #Circles
- #Doughnut Chart
- #16:9
- #donut chart PowerPoint
- #pie chart slide template
- #market share visualization
- #percentage data chart
- #regional analysis slide
- #donut graph presentation
About the Product
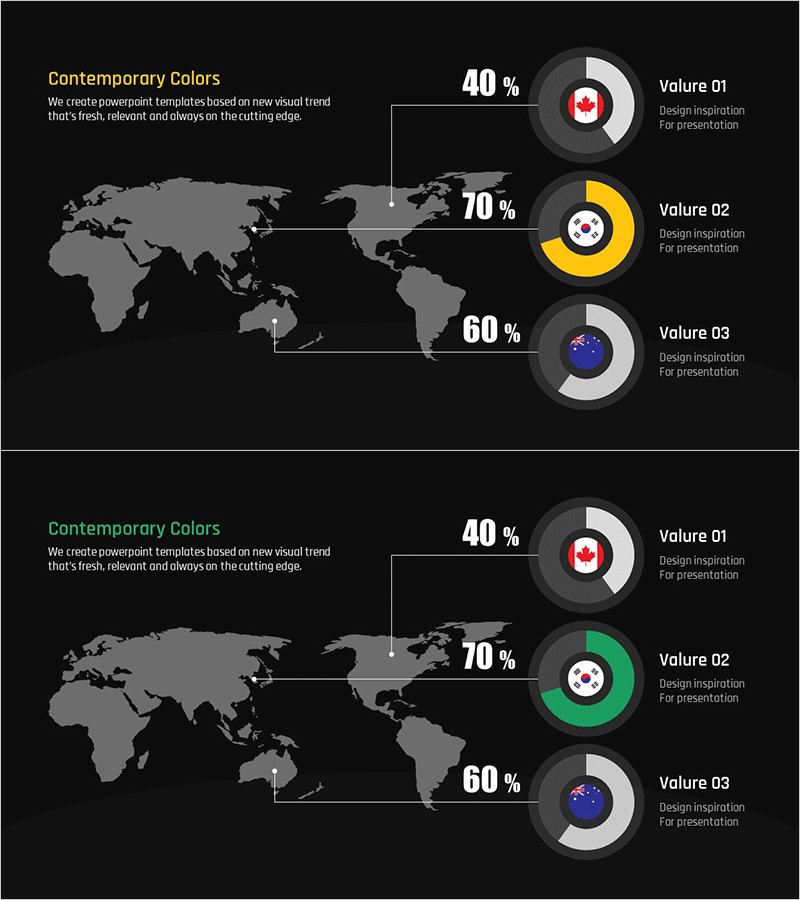
A PowerPoint slide featuring a 3-segment donut chart that visualizes target market development status and market share distribution. Set against a dark background, the slide displays data for Canada, South Korea, and Australia with flag icons and percentages (40%, 70%, 60%) represented in gray, yellow, and white tones. The 2-slide PPTX template in 16:9 format is fully editable and ideal for presenting regional market analysis, sales performance, customer distribution, and comparative ratio data in business presentations.
Usage Points
-
Main Usage
Display and compare three or more ratio datasets such as regional market share, sales percentages, or customer distribution at a glance. The donut structure allows for central placement of key metrics or titles, enhancing information clarity and visual impact.
-
How to Use
Replace the percentage values (40%, 70%, 60%) with your actual data and substitute flag icons with relevant region, department, or category names. Adjust the color scheme (gray, yellow, white) to match your corporate branding, and modify the black background to align with your overall presentation design.
-
Recommended For
Marketing professionals presenting market analysis reports, sales teams showcasing regional performance metrics, executive briefings on business segment ratios, investor presentations highlighting market penetration, and international business strategy meetings. Suitable for multi-regional companies and cross-functional stakeholder communications.
-
Slide Structure
The 2-slide template features a vertical axis layout with title and descriptive text on the left and three independent donut charts on the right. Each donut represents a separate data series with accompanying flag icons, percentages, and labels for easy regional or departmental comparison.
Related Products
-

Target Market Map for the US Space Industry – Market Analysis Slide
#Market and Competitor Analysis #Graph #Other
-

Target Country Market Share Analysis Graph
#Market and Competitor Analysis #Graph #Other
-

Lighting Graph – Market Share and Target Analysis
#Market and Competitor Analysis #Graph #Other
-

European Target Market Status Graph – Market Share Insights
#Market and Competitor Analysis #Graph #Other
