Orange Blue Regional Chart Analysis
RJ0600110_22
- Last Update 07/21/2025
- File Size 3.5MB
- # of Slides 2
- File Format PPTX
- Slide Ratio 16:9
- Color
Keywords
About the Product
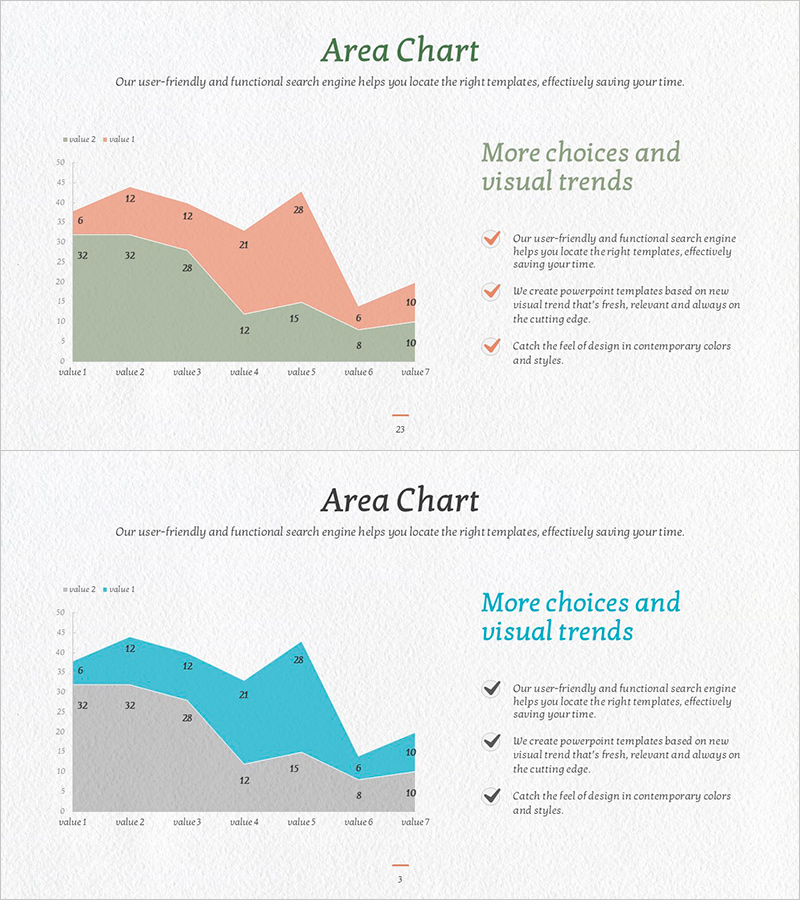
A professional area chart PowerPoint slide designed for market analysis and competitive comparison presentations. The slide features two distinct data series visualized in orange and blue, tracking trends across seven data points with clear numerical labels. The right side includes dedicated text space for insights and strategic commentary, making it ideal for presenting market share, sales trends, customer satisfaction metrics, and competitive positioning. This ready-to-use presentation slide enables quick data visualization without complex formatting, perfect for business reports, investor pitches, and strategic planning sessions.
Usage Points
-
Main Usage
Visualize comparative trends across two data series such as market share, sales performance, or competitive metrics over time. The stacked area format allows audiences to quickly grasp both individual series performance and combined market dynamics through visual area comparison.
-
How to Use
Input your actual data values into the area chart on the left side, then populate the right text box with analysis findings and strategic recommendations. The color-coded series (orange and blue) automatically distinguish between datasets, while numerical labels emphasize key data points for audience comprehension.
-
Recommended For
Executive reports, investor presentations, marketing strategy sessions, and business analysis meetings. Ideal for finance teams, marketing departments, and business planning units presenting data-driven insights to support strategic decision-making.
-
Slide Structure
Two-slide set featuring identical layouts in orange and blue color variations. Each slide contains a left-side area chart with seven data points across two series, numerical value labels, and a right-side text area for title and descriptive content.
Related Products
-

Distribution Graph of Food Materials – Market Status Chart
#Market and Competitor Analysis #Graph #Other
-

Avocado Share Chart – Market Status and Competitive Analysis
#Market and Competitor Analysis #Graph #Other
-

Market Share and Usage Status by Application – Statistical Analysis
#Market and Competitor Analysis #Graph #Other
-

3 Market Share Analysis – Differentiated Market Strategy
#Market and Competitor Analysis #Graph #Other
